Download
1 / 20
200 likes | 372 Vues
Populations in the Path of Natural Hazards. A lesson plan from “Making Population Real” by the Population Reference Bureau Supported by the World Population Fund of the Minneapolis Foundation. Today’s Agenda. Introduction

E N D
Populations in the Path of Natural Hazards A lesson plan from “Making Population Real” by the Population Reference Bureau Supported by the World Population Fund of the Minneapolis Foundation
Today’s Agenda • Introduction • Brief background on hurricane impacts related to the activity in the lesson plan • Map storm tracks and compare to population density maps in Florida • Discuss implications • More about Making Population Real and PRB
Making Population Real – Lesson Plan 3:In the Path of Natural Hazards
Objectives • To identify patterns of population change in areas with a history of major storm risk • To evaluate the human and economic costs of a major natural disaster • To explore why people move to places likely to experience major storms
Teaching Standards AP Geography Standard Addressed Unit II– Population Unit A. Geographical analysis of population 4. Population and natural hazards: past, present, and future AP and the Advanced Placement Program are registered trademarks of the College Entrance Examination Board which was not involved in the production of these lesson plans
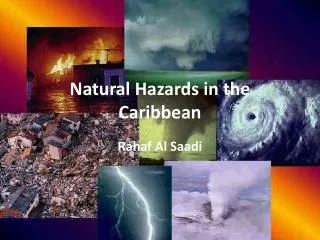
In the Path of Natural Hazards “Hurricanes and tropical storms have always been one of the primary causes of natural disasters in the Caribbean and the coastal southern United States. But the economic impact of hurricanes in these areas is growing far more severe.” - Roger-Mark De Souza, Population Reference Bureau
Construction in Harm’s Way: “Aggressive coastal development, especially the building of homes and businesses in… fragile areas, is also increasing human vulnerability to natural disasters. A 2000 study commissioned by the Federal Emergency Management Agency found that Americans have built more than 350,000 structures within 500 feet of U.S. coasts.” - Roger-Mark De Souza, Population Reference Bureau
Noting Vulnerability • U.S. insurance industry paid $39 billion between 2000-2004 for hurricanes and natural disasters; half the total for catastrophic events in prior 30 years • Globally 13 of 25 countries with the greatest number of natural disasters in 1970s and 1980s were small island states • Population growth, concentrations of poverty, migration to cities, and environmental degradation all increase impacts of storms Source: PRB, “In Harm’s Way,” 2004, www.prb.org/environment
Preventing Damage from Disasters: The World Bank and U.S. Geological Survey calculated that economic losses worldwide from natural disasters in the 1990s could have been reduced by $280 billion if $40 billion had been invested in preparedness, mitigation, and prevention strategies. • Charlotte Benson citing research on “The Cost of Disasters”
What do counties with greatest density have in common? Florida Counties, Population Density, 2000
UNISYS Weather Storm Tracks What do storm track maps tell us about vulnerability to hurricanes in Florida?
Group Work: Storm Tracks • Each group should draw the storm tracks that affected Florida for your assigned year • Where was their greatest impact?
Discussing the Impact of Hurricanes • Which have been the deadliest U.S. storms (1851-2004)? • Which have been the costliest? • What changed?
Discussing Population and Risks • Why do people move to coastal areas? • What are the risks? • What can or should be done about these risks? • From those suggestions, which options are most feasible?
Making Population Real – Lesson Plan 3:In the Path of Natural Hazards Activities: • Living on the Edge • Analyze Florida population density maps • Compare to storm track maps • Islands Facing Change • Analyze Puerto Rico population density maps • Compare to storm track maps
Making Population Real Lesson Plans • Population Fundamentals – Building a Foundation • Populations in the Path of Natural Hazards • The Demographic Transition – A Contemporary Look at a Classic Model • HIV/AIDS and Contemporary Population Dynamics • Population Policy – Progress Since Cairo • People on the Move • Global Migration Patterns
About Making Population Real • Free, on-line curricula utilize up-to-date real-world data and articles from a variety of web-based resources: • United Nations (UNICEF, UNHCR, WHO, etc.) • U.S. Census Bureau • National Oceanic and Atmospheric Administration • PRB research and publications • Lead author Martha B. Sharma • Recipient of the 2006 Geographic Excellence in Media Award from National Council for Geographic Education www.prb.org/educators
Population Reference Bureau • Informs people around the world about population, health, and the environment, and empowers them to use that information to advance the well-being of current and future generations. • Analyzes demographic data and research to provide objective, accurate, and up-to-date population information in a format that is easily understood by educators, journalists, and decision makers alike.