Download
1 / 15
150 likes | 289 Vues
Hydrology of Walnut Gulch, Arizona. Unearthing a First-Order Approximate Correlation Between Regional Hydrology and Extent of Vegetative Land Cover. Why Relate Hydrology and Vegetation?. Energy Transfer in an Ecosystem begins with Primary Producers Plants need Water…

E N D
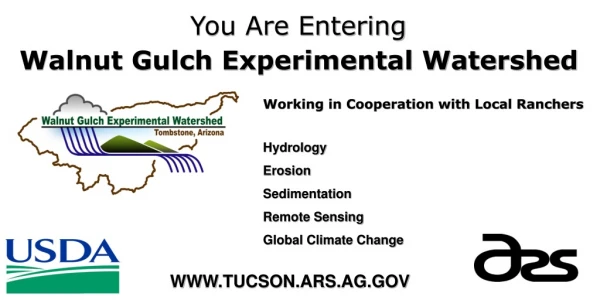
Hydrology of Walnut Gulch, Arizona Unearthing a First-Order Approximate Correlation Between Regional Hydrology and Extent of Vegetative Land Cover
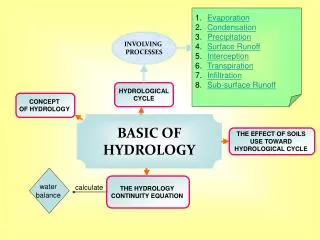
Why Relate Hydrology and Vegetation? • Energy Transfer in an Ecosystem begins with Primary Producers • Plants need Water… • Hydrologic Cycle dictates the sustainability of an Ecosystem
Methodology • Select model ecosystem • Select easily quantifiable hydrologic variables • Construct an “Average Hydrologic Year” model • Quantify Vegetative Land Cover • Correlate the average hydrologic year with the vegetative land cover
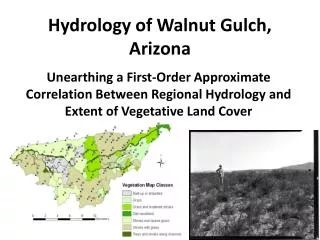
Model Ecosystem • Desert • RELATIVELY simple ecosystem • Most vegetation low shrub • Walnut Gulch is VERY well documented
Hydrologic Variables • Precipitation • Easy to Measure • Easy to Average over watershed area • Atmospheric Moisture • Easy to Measure and Average over watershed • Soil Moisture • Difficult to Measure over any extent • Highly Heterogeneous over watershed area
Quantifying Vegetative Cover • Fractional Absorbed Photosynthetically Active Radiation • faPAR = (PAR-rPAR)/PAR • rPAR = Reflected PAR PAR PAR rPAR rPAR
Conclusions and Future Work • For desert environments, Vegetative Land Cover seems to be predicted by Precipitation • Is this true for other, more hydrologically complex ecosystems? • What causes the phase shift? • Deeper exploration of Soil Moisture and Watershed Storage