David Schneider and Eric Steig
360 likes | 504 Vues
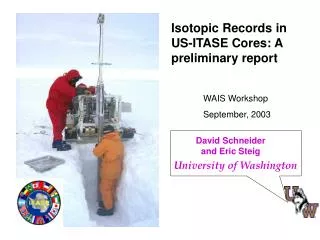
Isotopic Records in US-ITASE Cores: A preliminary report WAIS Workshop September, 2003. David Schneider and Eric Steig. University of Washington. Annual mean Accumulation at US-ITASE Sites (cm ^3 water-equivalent). Figure courtesy Dixon, Kaspari, Spikes. δ 18 O From 2001-5.

David Schneider and Eric Steig
E N D
Presentation Transcript
Isotopic Records in US-ITASE Cores: A preliminary report WAIS Workshop September, 2003 David Schneider and Eric Steig University of Washington
Annual mean Accumulation at US-ITASE Sites (cm^3 water-equivalent) Figure courtesy Dixon, Kaspari, Spikes.
2001-5 δ18O Dating of ice core: Based on summer sulphate and isotopic peaks.
Climatology (1982-1999) of temperature and δ18O at 2001-5 δ18O = .19*T - 26‰ r = .92
Isotopes from 2000-1 and reconstructed PC’s of Antarctic temperature r = .40 winter r = .28 annual
Two cores are better than one r = .37 annual; .39 winter R-pc1 annual mean Linear combination of 01-5 and 00-1
Three cores are better than two r = .54 annual; .52 winter R-pc1 annual mean Linear combination of 01-5 and 00-1 and Law Dome
Summary: • The cores can be well-dated with summer sulphate peaks, corroborated by isotopic annual cycles • Isotopic records exhibit a robust climatological relationship with the seasonal temperature cycle; a spatial relationship can be obtained once more cores are analyzed.
Summary: • The cores can be well-dated with summer sulphate peaks, corroborated by isotopic annual cycles • Isotopic records exhibit a robust climatological relationship with the seasonal temperature cycle; a spatial relationship can be obtained once more cores are analyzed. • The temporal isotopic-temperature slope appears to be much smaller than the traditional Dansgaard spatial slope (~0.2 vs ~0.64). • On seasonal to interannual timescales, temperatures at sites 2001-5 and 2000-1 are well correlated
Summary: • The cores can be well-dated with summer sulphate peaks, corroborated by isotopic annual cycles • Isotopic records exhibit a robust climatological relationship with the seasonal temperature cycle; a spatial relationship can be obtained once more cores are analyzed. • The temporal isotopic-temperature slope appears to be much smaller than the traditional Dansgaard spatial slope (~0.2 vs ~0.64). • On seasonal to interannual timescales, temperatures at sites 2001-5 and 2000-1 are well correlated • However, annual mean isotopic values are not well-correlated with annual mean temperatures at the site or between sites but the two cores agree better with Law Dome than with each other.
Summary: • The cores can be well-dated with summer sulphate peaks, corroborated by isotopic annual cycles • Isotopic records exhibit a robust climatological relationship with the seasonal temperature cycle; a spatial relationship can be obtained once more cores are analyzed. • The temporal isotopic-temperature slope appears to be much smaller than the traditional Dansgaard spatial slope (~0.2 vs ~0.64). • On seasonal to interannual timescales, temperatures at sites 2001-5 and 2000-1 are well correlated • However, annual mean isotopic values are not well-correlated with annual mean temperatures at the site or between sites. • Larger-scale measures of temperature variability (i.e. PC’s) show a better correlation with isotopic ratios than local T or circulation patterns alone. • Preliminary correlations of three ice cores with leading PC’s of Antarctic temperatures suggests ice core-based temperature reconstructions may agree well with station-based temperature reconstructions. • Rather than having conflicting information, these cores probably have complimentary information.
Multiple parameters in core 2001-5 T δ18O H2O2 SO42- 2002 1992 1982 Figure courtesy Dixon
Ongoing work: • Continue isotopic measurements on ITASE cores (21 sites!!) • More calibration exercises • Better understanding/interpretation of controls on interannual variability in isotopic ratios • Reconstruction of last 200-500 years of Antarctic climate variability
Annual mean temperature -60 -50 -40 -30 -20 °C from AVHRR
Monthly (1982-1999) regression between local temperature and δ18O at 2001-5 r = .59
Mean annual temperature- δ18O at 2000-1 δ18O T r = .30
Power spectra: 2000-1 Annual cycle Semiannual cycle
Power spectra: 2001-5 Annual cycle Semiannual cycle
Something about Hercules Dome (2002-4) • Could be easier than WAIS to relate to large-scale variability • But is the accumulation rate too low?
What determines isotopic ratios in an ice core? • Temperature when precipitation forms • Traditional to use mean annual surface temperature • May be better idea to use inversion temperature
What determines isotopic ratios in an ice core? • Temperature when precipitation forms • Traditional to use mean annual surface temperature • May be better idea to use inversion temperature • Timing of accumulation events; amount of precipitation • Temperature of source (place of evaporation) • Distance/pathway from source to deposition site
Multiple parameters in core 2001-5 Figure by Dixon