Download
1 / 69
690 likes | 888 Vues
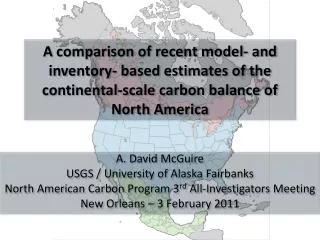
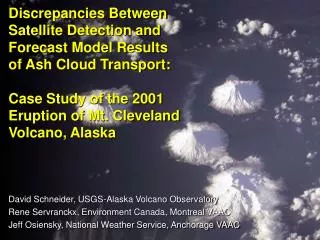
Discrepancies Between Satellite Detection and Forecast Model Results of Ash Cloud Transport: Case Study of the 2001 Eruption of Mt. Cleveland Volcano, Alaska. David Schneider, USGS-Alaska Volcano Observatory Rene Servranckx, Environment Canada, Montreal VAAC

E N D
Discrepancies Between Satellite Detection and Forecast Model Results of Ash Cloud Transport: Case Study of the 2001 Eruption of Mt. Cleveland Volcano, Alaska David Schneider, USGS-Alaska Volcano Observatory Rene Servranckx, Environment Canada, Montreal VAAC Jeff Osiensky, National Weather Service, Anchorage VAAC
Motivation/Background • The understanding that total avoidance of ash clouds is required but confusion about what is meant by (or how to achieve) “zero tolerance”. • A realization that operational decisions typically involve resolving conflicts between data sources. • How should warnings and info releases utilize model results, satellite data, and observer reports? What is the proper “weight” to give each when they are in conflict? • The question of how long to keep a warning going • A look at the 1991 eruption of Cleveland volcano will illustrate these issues, but not answer any of these questions.
Location Map Anchorage Cleveland Volcano R. Wessels • About 900 miles from Anchorage; 5675 ft high. • Eruption in 2001 is the largest from a seismically unmonitored volcano since the formation of AVO in 1988.
Summary of February 19 Eruption • Eruption detected in AVHHR satellite image as part of routine monitoring by an AVO remote sensing analyst, about 3 hours after the eruption start. • Ash production for about 6 hours, and detected in GOES satellite images for 48 hours. • No Color Code issued by AVO for Cleveland because of the lack of a seismic monitoring network (policy since changed). • Combined response of 3 VAACS (Anchorage, Washington, and Montreal), Anchorage Center Weather, and the AVO. Pointed out a need for additional tools to facilitate collaboration (VACT).
Ash Cloud Forecast Models • A number of models used by responding groups • PUFF: Anchorage VAAC and AVO • Canerm: Montreal VAAC • Vaftad: Washington VAAC • Although there are differences between the models, they are typically in general agreement. • Ash particles are essentially tracers of flow in the atmosphere, and output is influenced by a number of factors. The ash is predicted, not detected.
AVHRR Band 4 -60 Degrees C 50 AVHRR Band 4m5 -5 Degrees C 5 Satellite-based Ash Cloud Detection • Split-window method is a common technique: • Brightness temperature difference (BTD) between 2 thermal infrared channels • Semitransparent volcanic clouds generally have negative BTDs while meteorological clouds generally have positive BTDS
Satellite-based Ash Detection • The magnitude of the BTD signal depends upon many factors: • Cloud opacity (amounts of ash and water in the cloud) • Size and size distribution of the cloud particles • Temperature contrast between the cloud and the surface beneath it • Satellite viewing angle • Atmospheric conditions • Thus, the detection limit varies (+/-) between eruptions and during cloud transport.
Cold Cloud Thermal Anomaly -55 Degrees C 50 AVHRR Band 3: 2/19/01 1645 UTC
50 nmi (100 km) -5 Degrees C 5 AVHRR Band 4m5: 2/19/01 1645 UTC
-53.5 C - 33 C -55 Degrees C 10 AVHRR Band 4: 2/19/01 1645 UTC
-5 Degrees C 5 AVHRR Band 4m5: 2/19/01 1645 UTC Upper Level Cloud >FL300 Lower Level Cloud <FL200
1800 UTC: 2/19/01 E + 3 hours GOES Band 4m5 -5 Degrees C 4
FL S-200 FL 200-350 1800 UTC: 2/19/01E + 3 hours
2000 UTC: 2/19/01 E + 5 hours GOES Band 4m5 -5 Degrees C 4 Upper Level Cloud Appears in BTD Images SIGMET Covers this area at 2 levels Supported by PIREP
2200 UTC: 2/19/01 E + 7 hours GOES Band 4m5 -5 Degrees C 4 Lower Level Cloud Starts to “Fade” in BTD Images
0000 UTC: 2/20/01 E + 9 hours GOES Band 4m5 -5 Degrees C 4
FL S-200 FL 200-350 0000 UTC: 2/20/01E + 9 hours
GOES Band 4m5 -5 Degrees C 4 0200 UTC: 2/20/01 E +11 hours FL360: “Cinders and sulfur odor in cockpit” FL360: “Ash and sulfur odor in cockpit”
GOES Band 4m5 -5 Degrees C 4 0200 UTC: 2/20/01 E +11 hours SIGMET extended to cover cloud <FL400
GOES Band 4m5 -5 Degrees C 4 0400 UTC: 2/20/01 E +13 hours
GOES Band 4m5 -5 Degrees C 4 0600 UTC: 2/20/01 E +15 hours SIGMET “uses” more model guidance
FL S-200 FL 200-350 0600 UTC: 2/20/01E + 15 hours FL S-200
GOES Band 4m5 -5 Degrees C 4 0800 UTC: 2/20/01 E +17 hours
GOES Band 4m5 -5 Degrees C 4 1000 UTC: 2/20/01 E + 19 hours
GOES Band 4m5 -5 Degrees C 4 1200 UTC: 2/20/01 E + 21 hours
FL 200-350 1200 UTC: 2/20/01E + 21 hours FL S-200
GOES Band 4m5 -5 Degrees C 4 1400 UTC: 2/20/01 E + 23 hours
GOES Band 4m5 -5 Degrees C 4 1600 UTC: 2/20/01 E + 25 hours
GOES Band 4m5 -5 Degrees C 4 1800 UTC: 2/20/01 E + 27 hours As signal starts to fade, the SIGMETs give satellite images more “weight”.
FL S-200 FL 200-350 1800 UTC: 2/20/01E + 27 hours
GOES Band 4m5 -5 Degrees C 4 2000 UTC: 2/20/01 E + 29 hours
GOES Band 4m5 -5 Degrees C 4 2200 UTC: 2/20/01 E + 31 hours
GOES Band 4m5 -5 Degrees C 4 0000 UTC: 2/21/01 E + 33 hours
FL S-200 FL 200-350 0000 UTC: 2/21/01 E + 33 hours
GOES Band 4m5 -5 Degrees C 4 0200 UTC: 2/21/01 E +35 hours
GOES Band 4m5 -5 Degrees C 4 0400 UTC: 2/21/01 E +37 hours
GOES Band 4m5 -5 Degrees C 4 0600 UTC: 2/21/01 E +39 hours
FL S-200 FL 200-350 0600 UTC: 2/21/01 E +39 hours
GOES Band 4m5 -5 Degrees C 4 0800 UTC: 2/21/01 E +41 hours
GOES Band 4m5 -5 Degrees C 4 1000 UTC: 2/21/01 E +43 hours
GOES Band 4m5 -5 Degrees C 4 1200 UTC: 2/21/01 E +45 hours
FL S-200 FL 200-350 1200 UTC: 2/21/01 E +45 hours