Download
1 / 34
340 likes | 507 Vues
Introduction to Bayesian Mapping Methods. Andrew B. Lawson Arnold School of Public Health University of South Carolina. South Carolina congenital abnormality deaths 1990. Mapping issues. Relative risk estimation Disease Clustering Ecological analysis. Relative risk estimation.

E N D
Introduction to Bayesian Mapping Methods Andrew B. Lawson Arnold School of Public Health University of South Carolina
Mapping issues • Relative risk estimation • Disease Clustering • Ecological analysis
Relative risk estimation • SMRs (standardized mortality /morbidity ratios
Some notation • For each region on the map: • yi is the count of disease in the ith region • ei is the expected count in the ith region • θi is the relative risk in the ith region • The SMR is just smri = yi/ ei • This is just an estimate of θi
SMR problems • Notoriously unstable • Small expected count can lead to large SMRs • Zero counts aren’t differentiated • The SMR is just the data!
Smoothing for risk estimation • Modern approaches to relative risk estimation rely on smoothing methods • These methods often involve additonal assumptions or model components • Here we will examine only one approach: Bayesian modeling
Bayesian Modeling Some statistical ideas: • Likelihood…….we usually assume that counts of disease have a Poisson distribution so that yi has a Poisson distribution with expected value ei θi • We usually write this as yi ~Pois(ei θi) for short • The counts have a Poisson likelihood
Likelihood • The counts have a joint probability of arising based on the likelihood L(y, θ) : • L(y, θ) is the product of Poisson probabilities for each of the regions • This tells us how likely the data are given the expected rates (ei θi) • It also tells us what the most likely values of θ are given the data observed.
Maximum Likelihood • The SMR is the value of θ which gives the highest likelihood for the data (under a simple Poisson model)….this is called maximum likelihood (ML) • This approach is often used in statistics to get good estimates of parameters • Here we go beyond ML
Smoothing using Bayesian methods • One way to produce smoother relative risk estimators is to assume that the risk has a distribution • In Bayesian terms this is called a prior distribution • In the Poisson count example the commonest prior distribution is to assume that θi has a Gamma distribution
A simple Hierarchy • yi ~Poiss(ei θi) • θi ~Gamma(α,β) • This a very simple example which allows the risk to vary according to a distribution • α and β are unknown herea nd we can either try to estimate them from the data OR give then a distribution also: • E.g. α ~exp(υ),β ~exp(ρ)
Summary • Bayesian models are useful for smoothing disease relative risk estimates • They use prior distributions for parameters • The priors can be multi-level • The prior distributions can control the model results • Sensitivity to prior distributions is important
A basic Hierarchy Parameter • Data • Data 1st level 2nd level • distribution distribution Parameter Parameter
Modern Posterior inference • Unlike the usual ML estimates of risk, a Bayesian model is described by a distribution and so a range of values of risk will arise (some more likely than others) • Posterior distributions are sampled to give a range of these values (posterior sample) • This contains a large amount of information about the parameter of interest
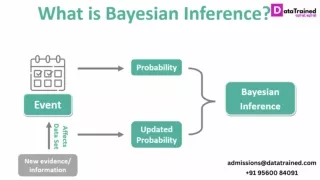
A Bayesian Model • A Bayesian model consists of a likelihood and prior distributions • The product of the likelihood and the prior distributions gives the most important distribution: the posterior distribution • In Bayesian modeling all the inference about parametersis made from the posterior distribution.
Posterior Sampling • The posterior distribution gives information about the distribution of parameters: not just about the most likely value • It is now relatively simple to obtain samples of parameters from posterior distributions • The commonest method for this is Gibbs Sampling
WinBUGS • This package has been set up to provide relatively easy access to Gibbs Sampling for a range of hierarchical models • The package is very flexible and implements Gibbs Sampling (and other Markov Chain Monte Carlo (MCMC) methods) • It also includes a GIS module called GeoBUGS which allows the mapping of the resulting fitted parameters (e.g. relative risks)
Disease Mapping on WinBUGS • WinBUGS is a very powerful tool which can be applied to: • Relative risk estimation • Putative health hazards (focused clustering) • Ecological analysis
A Simple Example • South Carolina congenital abnormality deaths 1990 • Data: counts of deaths in counties of South Carolina • Expected rates available as age x sex adjusted rates • The SMR map is next:
Using WinBUGS • WinBUGS is a windowed version of the BUGS package. BUGS stands for Bayesian inference using Gibbs Sampling • The package must be programmed to sample form Bayesian models • For simple models there is an interactive Doodle editor; more complex models must be written out fully.
Doodle Editor • The doodle editor allows you to visually set up the ingredients of a model • It then automatically writes the BUGS code for the model
Demonstration • Doodle example with simple nodes • SC congenital anomalies 1990 • Example 6.1.2 (burn-in 2000, final 6000 iterations) • Example 6.1.3 Log-normal model (6000 iterations) • Example 6.1.5 CAR –normal model (15000 iterations)
Extensions • Space-time modeling (Section 6.1 6) • Mixture modeling (section 6.1.7) • Focused clustering (analysis of putative health hazards) (Chapter 7) • Binomial models (Section 8.3.2) • Ecological regression (chapter 8) • Spatial survival analysis (Chapter 9)
Conclusions • WinBUGS provides a free and relatively easy-to-use tool for disease mapping with small area count data • Allows state-of-the-art approach to relative risk and ecological regression • Available from: www.mrc-bsu.cam.ac.uk/bugs