Download
1 / 27
270 likes | 392 Vues
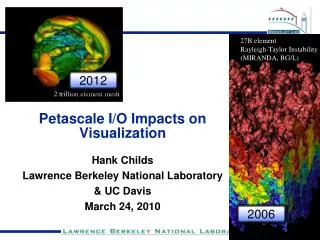
This presentation explores the significant challenges posed by petascale data management and I/O impacts on visualization in the study of Rayleigh-Taylor instabilities. Insights from simulations producing trillion-element meshes will be discussed, highlighting how increased data resolutions can overwhelm current I/O capabilities. We will examine techniques such as parallelism, multi-resolution approaches, and in-situ processing to mitigate these challenges. Moreover, we will address memory constraints and algorithmic changes necessary for effective data analysis and visualization in contemporary supercomputing environments.

E N D
27B element Rayleigh-Taylor Instability (MIRANDA, BG/L) 2012 Petascale I/O Impacts on Visualization 2 trillion element mesh Hank Childs Lawrence Berkeley National Laboratory & UC Davis March 24, 2010 2006
How does the {peta-, exa-} scale affect visualization? High-res meshes • Your mileage may vary • Are you running full machine? • How much data do you output? Large # of variables Large ensembles Large # of time steps
P2 P4 P1 P3 P0 P5 P8 P7 P6 P9 The soon-to-be “good ole days” … how visualization is done right now Parallel Simulation Code Parallelized visualization data flow network Read Process Render Processor 0 This technique is called “pure parallelism” Read Process Render P0 P1 P2 P3 Processor 1 P4 P5 P6 P7 Read Process Render Pieces of data (on disk) P8 P9 Processor 2
Vis is almost always >50% I/O and sometimes 98% I/O Amount of data to visualize is typically O(totalmem) “Petascale machine” Terascale machine Pure parallelism performance is based on # bytes to process and I/O rates. • Two big factors: • how much data you have to read • how fast you can read it • Relative I/O (ratio of total memory and I/O) is key Memory I/O FLOPs
Time to write memory to disk Anedoctal evidence: relative I/O really is getting slower.
“I/O doesn’t pay the bills” And I/O is becoming a dominant cost in the overall supercomputer procurement. Simulation codes aren’t as exposed. And will be less exposed with proposed future architectures. Why is relative I/O getting slower?
1TZ 16K, 32K Dawn Franklin Cray XT4 #cores Problem Size Type Machine 8K 0.5TZ AIX 16K 1TZ Purple Ranger BG/P 4TZ 64K Sun Linux Cray XT5 2TZ JaguarPF Juno Linux 1TZ, 2TZ 16K 32K Recent runs of trillion cell data sets provide further evidence that I/O dominates • Weak scaling study: ~62.5M cells/core 2T cells, 32K procs on Jaguar • Approx I/O time: 2-5 minutes • Approx processing time: 10 seconds 2T cells, 32K procs on Franklin 7
Summary: what are the challenges? • Scale • We can’t read all of the data at full resolution any more… • Q: What can we do? • A: We need algorithmic change. • Insight • How are we going to understand it? • (There is a lot more data than pixels!)
P2 P4 P1 P3 P0 P5 P8 P7 P6 P9 Multi-resolution techniques use coarse representations then refine. Parallelized visualization data flow network Parallel Simulation Code Read Process Render P2 Processor 0 Read Process Render P4 P0 P1 P2 P3 Processor 1 P4 P5 P6 P7 Read Process Render Pieces of data (on disk) P8 P9 Processor 2
Pros Drastically reduce I/O & memory requirements Cons Is it meaningful to process simplified version of the data? How do we generate hierarchical representations? What costs do they incur? Multi-resolution: pros and cons
P2 P4 P1 P3 P0 P5 P8 P7 P6 P9 In situ processing does visualization as part of the simulation. Parallel Simulation Code Read Process Render Processor 0 Read Process Render P0 P1 P2 P3 Processor 1 P4 P5 P6 P7 Read Process Render Pieces of data (on disk) P8 P9 Processor 2
P2 P4 P1 P3 P0 P5 P8 P7 P6 P9 In situ processing does visualization as part of the simulation. Parallelized visualization data flow network Parallel Simulation Code GetAccess ToData Process Render Processor 0 GetAccess ToData Process Render Processor 1 GetAccess ToData Process Render Processor 2 … … … … GetAccess ToData Process Render Processor 9
Pros: No I/O! Lots of compute power available Cons: Very memory constrained Many operations not possible Once the simulation has advanced, you cannot go back and analyze it User must know what to look a priori Expensive resource to hold hostage! In situ: pros and cons
Three primary use cases: Exploration Confirmation Communication Now we know the tools … what problem are we trying to solve? Will still need pure parallelism and possibly other techniques such as data subsetting and streaming. Multi-res Examples: Scientific discovery Debugging Examples: Data analysis Images / movies Comparison In situ Examples: Data analysis Images / movies
Prepare for difficult conversations in the future. • Multi-resolution: • Do you understand what a multi-resolution hierarchy should look like for your data? • Who do you trust to generate it? • Are you comfortable with your I/O routines generating these hierarchies while they write? • How much overhead are you willing to tolerate on your dumps? 33+%? • Willing to accept that your visualizations are not the “real” data?
Prepare for difficult conversations in the future. • In situ: • How much memory are you willing to give up for visualization? • Will you be angry if the vis algorithms crash? • Do you know what you want to generate a priori? • Can you re-run simulations if necessary?
Visualization on BlueWaters: Two Scenarios • Pure parallelism continues (no SW change): • Visualization and analysis will be done using large portions of BW, users charging against science allocations • Lots of time spent doing I/O • This increases overall I/O contention on BW • Vis & analysis is slow people do less ( insights will be lost (?)) • Smart techniques deployed: • Allocations are used for simulation, not vis & analysis • Less artificial I/O contention introduced • Ability to explore / interact with data
VisIt is a richly featured, turnkey application 1 billion grid points • VisIt is an open source, end user visualization and analysis tool for simulated and experimental data • Used by: physicists, engineers, code developers, vis experts • >100K downloads on web • R&D 100 award in 2005 • Used “heavily to exclusively” on 8 of world’s top 12 supercomputers 217 pin reactor cooling simulation. Run on ¼ of Argonne BG/P. 4 18
Visual Debugging ? = Quantitative Analysis Data Exploration Comparative Analysis Presentations Terribly Named!! Intended for more than just visualization! 19
VisIt has a rich feature set that can impact many science areas. • Meshes: rectilinear, curvilinear, unstructured, point, AMR • Data: scalar, vector, tensor, material, species • Dimension: 1D, 2D, 3D, time varying • Rendering (~15): pseudocolor, volume rendering, hedgehogs, glyphs, mesh lines, etc… • Data manipulation (~40): slicing, contouring, clipping, thresholding, restrict to box, reflect, project, revolve, … • File formats (~85) • Derived quantities: >100 interoperable building blocks +,-,*,/, gradient, mesh quality, if-then-else, and, or, not • Many general features: position lights, make movie, etc • Queries (~50): ways to pull out quantitative information, debugging, comparative analysis 20
localhost – Linux, Windows, Mac Graphics Hardware VisIt employs a parallelized client-server architecture. • Client-server observations: • Good for remote visualization • Leverages available resources • Scales well • No need to move data remote machine User data Parallel vis resources • Additional design considerations: • Plugins • Multiple UIs: GUI (Qt), CLI (Python), more… 21
The VisIt team focuses on making a robust, usable product for end users. • Manuals • 300 page user manual • 200 page command line interface manual • “Getting your data into VisIt” manual • Wiki for users (and developers) • Revision control, nightly regression testing, etc • Executables for all major platforms • Day long class, complete with exercises Slides from the VisIt class 22
More developers Entering repo all the time Institutional support leverages effort from many labs Partnership with CEA is developed Project started UC Davis & UUtah research done in VisIt repo VACET is funded Developers from LLNL, LBL, & ORNL Start dev in repo AWE enters repo LLNL user community transitioned to VisIt GNEP funds LLNL to support GNEP codes at Argonne 2005 R&D100 SciDAC Outreach Center enables Public SW repo Saudi Aramco funds LLNL to support VisIt User community grows, including AWE & ASC Alliance schools 2003 2007 2007 2004-6 ‘07-’08 ‘07-’08 2000 2005 Summer‘07 Spring ‘08 Spring ‘07 VisIt is a vibrant project with many participants. • Over 50 person-years of effort • Over one million lines of code • Partnership between: Department of Energy’s Office of Nuclear Energy, Office of Science, and National Nuclear Security Agency, and among others • NSF XD centers both expected to make large contributions. Fall ‘06 2008 Spring ‘09 23
VisIt: What’s the Big Deal? • Everything works at scale • Robust, usable tool • Vis to code development to scientific insight 24
VisIt and the smart data techiques • Full pure parallelism implementation • Data subsetting well integrated • (if you set up your data properly) • In situ: yes, but … it’s a memory hog • Multi-res: emerging effort in this space
Three Ways To Get Data Into VisIt • (1) Write to a known output format • (2) Write a plugin file format reader • (3) Integrate VisIt “in situ” • “lib-VisIt” is linked into simulation code • (Note: Memory footprint issues with implementation!) • Use model: • simulation code advances • at some time interval (e.g. end of cycle), hands control to lib-VisIt. • lib-VisIt performs vis & analysis tasks, then hands control back to simulation code • repeat 26
Summary • Massive data will force algorithmic change in visualization tools. • The VisIt project is making progress on bringing these algorithmic changes to the user community. • Contact info: • Hank Childs, LBL & UC Davis • hchilds@lbl.gov / childs@cs.ucdavis.edu • http://vis.lbl.gov/~hrchilds Questions??