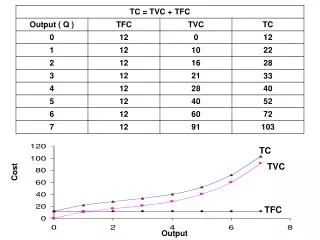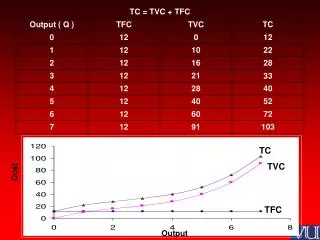
TC, TVC, TFC
TC, TVC, TFC. TFC. 0. Q 1. Q 2. Q. ATC. MC. AVC. AFC. 0. Q. 10. MC. 9. ATC. 8. 7. AVC. 6. 5. 4. 3. 2. 1. 1. 2. 3. 4. 5. 6. 7. 8. 9. 10. 10. MC. 9. ATC. 8. 7. AVC. 6. 5. 4. 3. 2. 1. 1. 2. 3. 4. 5. 6. 7. 8. 9. 10. Profit Maximization:.

TC, TVC, TFC
E N D
Presentation Transcript
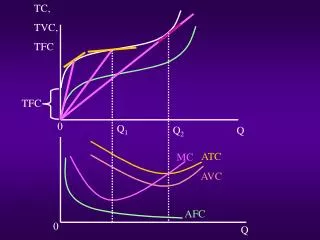
TC, TVC, TFC TFC 0 Q1 Q2 Q ATC MC AVC AFC 0 Q
10 MC 9 ATC 8 7 AVC 6 5 4 3 2 1 1 2 3 4 5 6 7 8 9 10
10 MC 9 ATC 8 7 AVC 6 5 4 3 2 1 1 2 3 4 5 6 7 8 9 10
Profit Maximization: Profit = Total Revenue - Total Cost Total Revenue (TR) = P × Q Average Revenue (AR) = TR÷Q =
Marginal Revenue: It measures the change in total revenue generated by one additional unit of goods or services.
Weekly Revenue and Cost Data for a Gold Miner Price of Gold = $600 / oz
MR MC MC P P = MR 0 q Output
Fig. A MC ATC AVC a P c b q 0
10 MC 9 ATC 8 7 AVC 6 5 4 3 2 1 1 2 3 4 5 6 7 8 9 10
Fig. C MC ATC AVC b c P a n m 0 q
Fig. B MC ATC AVC b c P a 0 q
10 MC 9 ATC 8 7 AVC 6 5 4 3 2 1 1 2 3 4 5 6 7 8 9 10
10 MC 9 ATC 8 7 AVC 6 5 4 3 2 1 1 2 3 4 5 6 7 8 9 10
10 MC 9 ATC 8 7 AVC 6 5 4 3 2 1 1 2 3 4 5 6 7 8 9 10
10 MC 9 ATC 8 7 AVC 6 5 4 3 2 1 1 2 3 4 5 6 7 8 9 10