Download

1 / 20

E N D
Occupational marriage networks in the USA, 1970-2010Dave Griffiths & Paul LambertSchool of Applied Social Science, University of StirlingPaper presented to Social Stratification Research Seminar, 1 September 2011, University of StirlingWork for this paper is supported by the ESRC as part of the project ‘Social Networks and Occupational Structure’, see http://www.camsis.stir.ac.uk/sonocs/
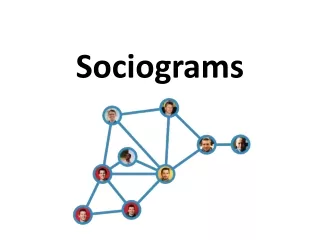
Generating networks sociograms of the occupational structure • Testing reliability of obtaining data from large-scale social surveys • Initial results of mapping occupational structure using SNA methods • Examine occupational categorisation schemes
Most common occupations for the wives of lawyers and labourers in the USA Source: Current Population Survey 2010.
Most common occupations for the wives of lawyers and labourers in the USA Source: Current Population Survey 2010.
www.camsis.stir.ac.uk/sonocs/do/pajek.do **create frequency dataset capture drop freq gen freq = 1 collapse (count) freq, by(hocc wocc) list in 1/20 *****Find total for each category capture drop tot egen tot=sum(freq) summarize tot *******Find totals for men and women capture drop nhocc capture drop nwocc egen nhocc=sum(freq), by(hocc) egen nwocc=sum(freq), by(wocc) ****Find percentage for each category for men and women capture drop phocc capture drop pwocc gen phocc=nhocc/tot gen pwocc=nwocc/tot Summarize *******Calculate expected numbers of women capture drop ewocc gen ewocc=pwocc*nhocc Summarize **************create expectation surplus capture drop value gen value=freq/ewocc ************Create standard error predictions capture drop prop gen prop = freq/tot capture drop staner gen staner = sqrt((prop)*(1 - prop) / tot) list freq tot phocc pwocc ewocc value prop staner in 1/20 capture drop pro_obs gen pro_obs = freq/tot capture drop pro_exp gen pro_exp = ewocc/tot capture drop pro_min gen pro_min = pro_obs – staner capture drop pro_max gen pro_max = pro_obs + staner capture drop value gen value = pro_obs / pro_exp capture drop val_min gen val_min = pro_min / pro_exp capture drop val_max gen val_max = pro_max / pro_exp ***label variables label variable tot "total number in sample" label variable nhocc "total number of males in occupation" label variable nwocc "total number of females in occupation" label variable phocc "percentage of men in occupation" label variable pwocc "percentage of women in occupation" label variable ewocc "expected number of partnerships" label variable staner "Standard error for tie" label variable pro_obs "Observed proportion of all ties" label variable pro_exp "Expected proportion of all ties" label variable pro_min "Lower confidence interval of observed proportion" label variable pro_max "Higher confidence interval of observed proportion" label variable value "Observed value of representation" label variable val_min "Value of representation for lower confidence interval" label variable val_max "Value of representation for higher confidence interval"
Hypothetical network: 469 US OUGs & micro-classes Medical and dental technicians Medical professionals (Four different isolated components with internal links within microclass but no external links) Green: professional; Blue: routine non-manual; Red: manual; Yellow: primary; Black: military ‘Pseudo-diagonal’ or ‘situs’ Dental hygienists (further isolated components)
Occupational Structure, USA 2010 Source: CPS 2010 Green: Professional; Yellow: routine non-manual; Red: Manual; Black: Farming
IT Teaching assistants crossing prestige levels Primary school teachers connecting to a range of occupations teaching Occupational Structure, USA 2010 Source: CPS 2010 Green: Professional; Yellow: routine non-manual; Red: Manual; Black: Farming Farming communities with ties to all social levels Estate agents between stratified blocks Hotel workers Food service managers and food preparation managers and waitresses
1990 19952000 2005 Position of Receptionists
Over-represented graduate non-graduate marriage ties in USA 1970-2010 Source: Current Population Survey Note: Italics indicate the female occupation.
Percentage of graduates in managerial roles, USA 1985-2010 Source: Current Population Survey: 1985-2010 (http://www.cps.ipums.org/cps)
Conclusions • Social Network Analysis can provide empirical evidence of occupational stratification • Networks should be interpreted in terms of wide trends rather than specific occupations • Little evolution of marriage networks in last 40 years of USA, but educational cohort effects are emerging • Microclasses generally a sound way to group occupations, although social interaction patterns suggest not quite maximal.
Bibliography Blackwell, D.L. (1998) ‘Marital Homogamy in the United States: The Influence of Individual and Parental Education’, Social Science Research, 27, 159-188. Blau, P.M. & Duncan, O.D. (1967) The American Occupational Structure. New York: Wiley. Chan, T.W. (ed) (2010) Social Status and Cultural Consumption. Cambridge: Cambridge University Press. Ganzeboom, H. B. G., & Treiman, D. J. (1996). Internationally Comparable Measures of Occupational Status for the 1988 International Standard Classification of Occupations. Social Science Research, 25(3), 201-235. Griffiths, D., and Lambert, P.S. (Forthcoming) Dimensions and Boundaries: Comparative Analysis of Occupational Structures Using Social Network and Social Interaction Distance Analysis Grusky, D. B., & Weeden, K. A. (2001). Decomposition Without Death: A Research Agenda for a New Class Analysis. Acta Sociologica, 44(3), 203-218. Grusky, D. B., & Weeden, K. A. (2006). Does the sociological approach to studying social mobility have a future? in S. L. Morgan, D. B. Grusky & G. S. Fields (Eds.), Mobility and Inequality. Stanford: Stanford University Press. Jonsson, J. O., Grusky, D. B., Di Carlo, M., Pollak, R., & Brinton, M. C. (2009). Microclass Mobility: Social Reproduction in Four Countries. American Journal of Sociology, 114(4), 977-1036. Kalmijn, M. (1998). Intermarriage and homogamy: Causes, patterns, trends. Annual Review of Sociology, 24, 395-421. King, M., Ruggles, S., Alexander, J.T., Flood, S., Genadek, K., Schroeder, M.B., Trampe, B., and Vick, R. (2010) Integrated Public Use Microdata Series, Current Population Survey: Version 3.0. [Machine-readable database]. Minneapolis: University of Minnesota. Laumann, E.O., & Guttman, L. (1966) ‘The Relative Associational Contiguity of Occupations in an Urban Setting’, American Sociological Review, 31, 169-178. Lambert, P. S., Tan, K. L. L., Gayle, V., Prandy, K., & Bergman, M. M. (2008). The importance of specificity in occupation-based social classifications. International Journal of Sociology and Social Policy, 28(5/6), 179-192. Lin, N., & Erickson, B.H. (eds) (2008) Social Capital: An International Research Program. Oxford: Oxford University Press. McDonald, K.I. (1972) MDSCAL and distances between socio-economic groups’ in K. Hope (ed) The Analysis of Social Mobility: Methods and Approaches. London: Clarendon. Oesch, D. (2006). Redrawing the Class Map: Stratification and Institutions in Britain, German, Sweden and Switzerland. Basingstoke: Palgrave. Putnam, R. (2000) Bowling Alone: The collapse and revival of American Community. New York: Simon & Schuster. Schartz, C.R., and Mare, R.D. (2005) “Trends in Educational Assortative Marriage from 1940 to 2003”, Demography, 42(4), 621-646. Stewart, A., Prandy, K., & Blackburn, B. (1973) Measuring the Class Structure, Nature, 415-417. Treiman, D. J. (1977). Occupational Prestige in Comparative Perspective. New York: Academic Press. van derGaag, M., Snjiders, T., and Flap, H. (2008) “Position Generator Measures and their Relationships to Other Social Capital Measures”, in N. Lin & B.H. Erikson (eds). Social Capital: An International Research Program. Oxford: Oxford University Press. Weeden, K. A., (2004). "Profiles of Change: Sex Segregation in the United States, 1910-2000" in M. Charles, & D. Grusky, (eds) Occupational Ghettos. Stanford: Stanford University Press, 131-178. Weeden, K. A., & Grusky, D. B. (2005). The Case for a New Class Map. American Journal of Sociology, 111(1), 141-212.