Download
1 / 26
270 likes | 304 Vues
Explore the potential of Modelica for HVAC system control modeling and optimization. Case studies demonstrate the efficiency and challenges in using equation-based modeling for intelligent building operations.

E N D
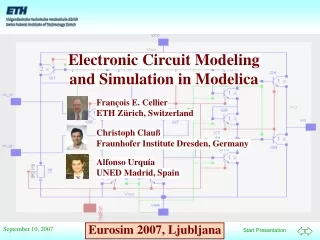
Modeling of HVAC System for Controls Optimization Using Modelica Wangda Zuo1, Michael Wetter2 1 Department of Civil, Architectural and Environmental Engineering, University of Miami, Coral Gables, FL 2 Building Technology and Urban Systems Department, Lawrence Berkeley National Laboratory, Berkeley, CA Intelligent Building Operations Workshop 06/21/2013
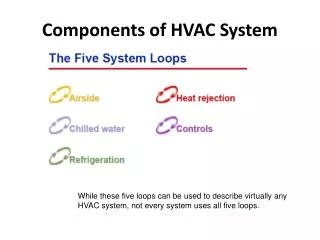
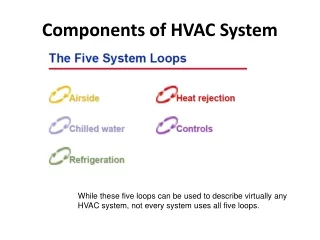
Outline Introduction Case 1: Modeling a Direct Expansion Coil Case 2: Optimization of Chiller Plant Control for Data Center Conclusion and Outlook 2
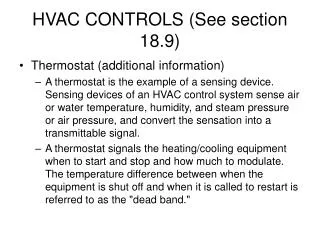
Introduction • Motivation • Energy saving potential from better building control is about 30% • Computer tools can be used for the design, evaluation and optimization of HVAC control • Limitation of Current Tools • Idealized control • Time step too large • Fixed time step • Opportunity with Modelica • Equation-based object-oriented modular modeling • Fixed and variable time step solvers 3
Case 1: Modeling of a DX Coli North Wing of Building 101, Philadelphia, PA DX Coil with 2 Condensing Units 4
Measured Data Measured Power for August 2012
Model Calibration Design Using measured data to calibrate the nominal COPs for performance curves of 6 stages so that calculated energy consumption is close to measured data.
Calibration Model Measured Data Tout [degC] Power [W] Energy [J] 0.3% difference Variable Speed DX coil, 8/1-8/7/2012
Validation Model Measured Data Tout [degC] Power [W] Energy [J] 4% difference Variable speed DX Coil, 8/15-8/21/2012
Discrete vs. Continuous Time Control • Option 1: Variable Speed DX Coil • Control input: Real from 0 to 1 • Coil runs smoothly using performance curves for 6 speeds • Option 2: 6 Stage DX Coil • Control input: Integer from 0 to 6 • A time delay twai is used to prevent short cycling
Discrete vs. Continuous Time Control Model Measured Data Tout Variable Speed DX Coil (Continuous) 6-Stage DX Coil, twai=120s (Discrete) 6-Stage DX Coil, twai=1s (Discrete) Simulation of 8/1-8/7/2012
Discrete vs. Continuous Time Control Comparison of Numerical Performance Simulation of 8/1-8/7/2012
Outline Introduction Case 1: Modeling of a Direct Expansion Coil Case 2: Optimization of Chiller Plant Control for Data Center Conclusion and Outlook 12
Case 2: Chiller Plant for Data Center Cooling • Background: • 1.5 percent of the nation’s electricity. • halfof the electricity in data centers is used for cooling. Objective: Decrease Power Usage Effectiveness (PUE): PUE= Challenges in Optimization:
Configurations Condenser Water Pump WSE Tchi,max Chilled Water Pump Fan Tair,set 14
Setpoint Reset Control Chilled Water Loop Difference Pressure and Chiller Setpoint Temperature Reset Modelica Implementation 16
Water Side Economizer Control Schematic of State Graph Modelica Implementation 17
Results: With and Without WSE • How much does the 0.13 in PUE for a 500 kW data center mean? • 438,000 kWh / year • $87,600 if $0.2 / kWh 18
Results: With and Without WSE Without WSE With WSE 19
System With WSE: Hours of Chiller Operation Tair,set 18C 27C Tchi,max 6C 22C 20
Discrete vs. Continuous Time Control Discrete Time Control (Trim and Response Logic) Continuous Time Control (PI Control) 22
Discrete vs. Continuous Time Control Comparison of Numerical Performance 23
Outline Introduction Case 1: Modeling of a Direct Expansion Coil Case 2: Optimization of Chiller Plant Control for Data Center Conclusion and Outlook 24
Conclusion and Challenges Conclusion The case studies demonstrate the potential of Modelica for the modeling and optimization of HVAC system control Model performance varies depending on how it is constructed Challenges How to ensure that the models can be stably and efficientlysolved? How to handle the fast transient in control system and slow response in building thermal system at the same time? 25
Acknowledgements • Collaborators: • Purdue University: Donghum Kim, James Braun • EEB Hub: Ke Xu, Richard Sweetser, Tim Wagner • Funding Agencies: • Department of Energy • Energy Efficient Buildings Hub 26