Analyzing the Impact of an Outlier in Air Hockey Tournament Results
This example examines the effect of an outlier on the mean, median, mode, range, and standard deviation of a data set in an air hockey tournament. It also discusses which measure of central tendency is most and least affected by the outlier and the impact on the range and standard deviation. Additionally, it provides a hypothetical scenario and calculates the new statistics if a different outlier score is introduced.

Analyzing the Impact of an Outlier in Air Hockey Tournament Results
E N D
Presentation Transcript
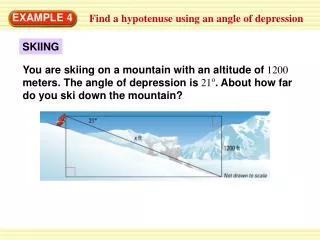
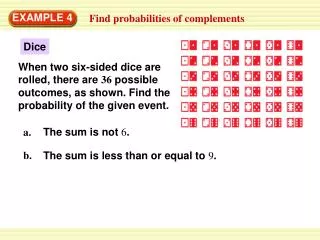
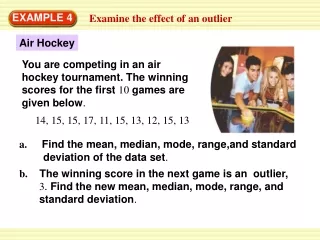
Air Hockey EXAMPLE 4 Examine the effect of an outlier You are competing in an air hockey tournament. The winning scores for the first 10 games are given below. 14, 15, 15, 17, 11, 15, 13, 12, 15, 13 a. Find the mean, median, mode, range,and standard deviation of the data set. b. The winning score in the next game is an outlier, 3. Find the new mean, median, mode, range, and standard deviation.
... 14 + 15 + + 13 a. Mean: 14 = = x 10 EXAMPLE 4 Examine the effect of an outlier c. Which measure of central tendency does the outlier affect the most? the least? d. What effect does the outlier have on the range and standard deviation? SOLUTION Median:14.5Mode:15 Range:17 – 11 = 6
… – – – (14 14)2+ (15 14)2+ + (13 14)2 Std. Dev.: 1.5 = 10 ... 14 + 15 + + 3 b. Mean: 13 = = 11 x … – – – (14 13)2+ (15 13)2+ + ( 3 13)2 Std. Dev.: 3.5 = 11 EXAMPLE 4 Examine the effect of an outlier Median:14 Mode:15 Range:17 – 3 = 14
EXAMPLE 4 Examine the effect of an outlier c. The mean is most affected by the outlier. The mode is least affected by the outlier. d. The outlier causes both the range and standard deviation to increase.
3. What If?In part (b) of Example 4, suppose the winning score in the next game is 25 instead of 3. Find the new mean, median, mode, range, and standard deviation of the data set . Mean: ... = 14 + 15 + + 25 11 15 = x … – – – (14 15)2+ (15 15)2+ + ( 25 15)2 Std. Dev.: = 11 for Example 4 GUIDED PRACTICE SOLUTION Median:15Mode:15 Range:25 – 11 = 14 = 3.5