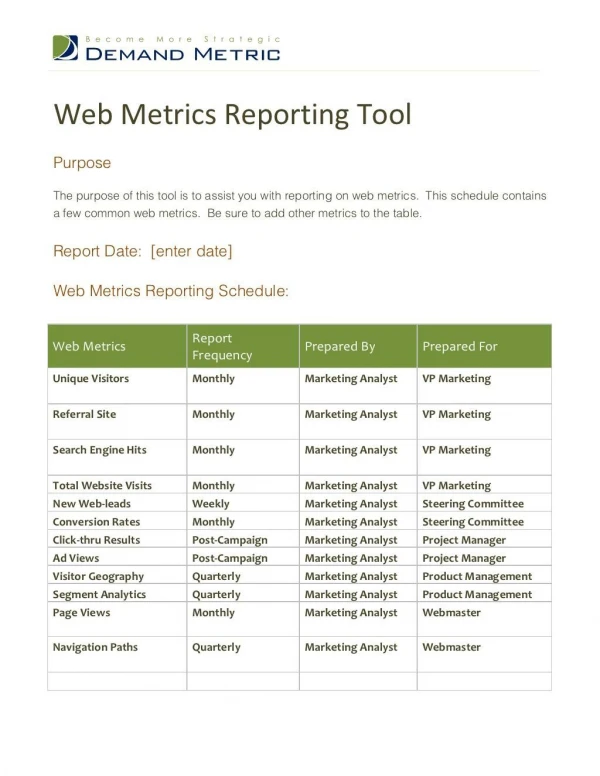
Download
1 / 68
680 likes | 846 Vues
Why measure? Determining goals What to measure? How to measure? Putting it all together (examples). Web metrics - A primer. Web metrics - Caveats. Web metrics is a huge (and growing) field, with new strategies and businesses starting (and dying) every day.

E N D
Why measure? • Determining goals • What to measure? • How to measure? • Putting it all together (examples) Web metrics - A primer
Web metrics - Caveats • Web metrics is a huge (and growing) field, with new strategies and businesses starting (and dying) every day. • This talk only covers a few, key, publicly available tools and services (Google Analytics, YouTube, Facebook, Twitter) • Even for some public tools (e.g. Google Analytics), there is no way to cover all the options available • Many professional options available, but not covered or evaluated here • Counting on you to share info on additional tools, services, tips, etc.
1. Why measure?(determines what questions you want to ask) • Curiosity • Improve web-site visitor experience • Increase visibility of institution • Improve “reach” of news releases • Important to decide on goals before spending a lot of time, effort, and possibly money on web monitoring
- Why measure? Benefits of measuring • Find out what’s working (and what’s NOT working) for web visitors • Identify and improve key “channels” for reaching media • Impress management / justify programs and staff efforts (cost/benefit analysis) • Help with institutional goals for outreach, marketing, fundraising – increasingly a part of PIO’s role, especially for small organizations.
- Why measure? Cost-benefit analysis • Increasingly important with tighter budgets • Costs are relatively easy to predict compared with benefits • Web metrics are a great way of demonstrating benefits • Don’t forget to include cost/time for data analysis in web metrics
2. Defining goals • Simple • Easy to measure • Realistic • Relate to core mission of institution(Strategic plan, etc.) • Relate to core mission of your department
- Defining goals Some general types of web goals • Sharing information/inspiration • Defining or improving institution’s public image or “brand” • Attracting new audiences / increasing overall public awareness • Facilitating 2-way communication • Inspiring action (e.g. ocean conservation; fund raising)
- Defining goals Examples of specific goals • Make sure that all major wire services are aware of our news releases • Increase the size of our news release mailing list by 50% • Increase number of times a month that our research is mentioned in science blogs • Increase # of Twitter followers by 50% over next six months • Increase number of monthly hits on “Open House” web page by 20%
3. What to measure(what CAN be measured) • News coverage by organizations and by web users (blogs, tweets, etc.) • Number of views of a story, video, or tweet • Number/type/demographics of users • How interested users are in your information • Paths that users follow to access your information • Whether users are going where you want them do and doing what you want • Trends over time
- What to measure Deciding what to measure • There are so many different things you can measure on the web that it is most efficient to: • Do research (and periodic updates) on what metrics are available for the web “channels” you use. • Pick a limited set of metrics that are most useful for you (customize if appropriate) • Monitor those metrics consistently & regularly • Keep your own records • Periodically & regularly analyze the data and look for trends over time (prepare reports for superiors)
- What to measure Measuring news coverage • Traditional approach: How many publications wrote articles on your release (and how big are the pubs?) • How many blogs and news aggregator sites reprinted your release verbatim (or with minor variations)? • How many blogs mentioned or linked back to your release? (and how large is their readership?) • Quality of coverage is subjective, but important because web is an “echo chamber” • How many times did it get tweeted/retweeted? • How many people “Liked” it on Facebook?
- What to measure Measuring views of a page/story/video, etc. • Number, timing, and sources of page views are easy to measure for internal web sites using web monitoring tools • Tracking links to external site tougher, but tools available for some (e.g. YouTube) • Highest page views often due to links from mainstream-media sites and blogs with large numbers of viewers (>5-10,000 viewers) • Gee-whiz factor is often key for big views; but most of these will be one-time viewers.
- What to measure Key terms used in web-page monitoring (not standardized) • “Hit” • Occurs each time a FILE (any file) is supplied by the web server (only available with “server-log tracking”; more on this later). • More representative of total server traffic than popularity because many FILES may be downloaded as part of a single page (and caching issues). • “Page view” • Occurs each time a particular type of file (e.g. html) is supplied by the server (in “server logging”) or a particular page script runs (in “page tagging”).
- What to measure Key terms used in web-page monitoring (continued) • “Visit” • Occurs when a single client downloads a series of page requests within a 30-minute period. • A visit ends if no requests from a particular client come over a 30 minute period. • “Session” • Like a visit, but ends either after 30 minutes without accessing a local page OR if accesses a page from a different site. • “A session ends when someone goes to another site, or 30 minutes elapse between page views, whichever comes first.”
- What to measure Measuring number / demographics of users • Number of visitors over a specific time period • Number of regular visitors (e.g. YouTube “subscribers,” Facebook “likes,” Twitter “followers,” rss feed subscribers?) • Age, sex (for registered users) • Geographic location (sometimes to zip code)
- What to measure Key terms used in user monitoring (not standardized) • “Unique visitor” • A key term, based on identifying the computer (not the person) that is accessing a particular web site over a specified time period of record-keeping (typically a day, week, or month). • Determined using IP address in server log or cookie/Flash script; thus, a single person visiting from two different computers will count as two Unique Visitors • Note: If you add up the number unique visitors for each day in a month, they will not equal the total number of unique visitors for that month (because the same person visiting two days in a month is counted twice in the daily counts of unique visitors)
- What to measure Key terms used in user monitoring (continued) • “New visitor” • A new visitor is a visitor that has not made any previous visits (over the entire period or record-keeping). • “Repeat visitor” • A repeat visitor that has made at least one previous visit to the site in a specific period of time. • Reliability limited by people whose browsers delete cookies each time they exit (they look new each time). • Note: The total number of unique visitors is not necessarily the same as the new plus repeat visitors because one person can be both new and repeat in a single day.
- What to measure Importance of demographics • Who is following you is at least as important is how many. • Demographics available from services where users sign up (Facebook followers; registered YouTube users) • Demographics of registered users does not necessarily represent demographics of all viewers (especially on YouTube)
- What to measure Measuring how interested users are in your information • Time on site/page/session • Repeat visitors/followers • User interactions (comments, shares, “likes,” etc.) • Retweets • Offsite links to content
- What to measure Key terms used in user-interest monitoring (not standardized) • “Bounce” • A single page view without additional views in 30 minutes. The “bounce rate” is the percentage of visits in this category over a particular period of time. • “Time on page” • Possible to measure using custom Javascript code. But reliability questionable because user may have many pages open at once. • “Session duration” • Possible to measure, but accuracy questionable • “Average page views per session” • Easier to measure (total page views/total number of sessions)
- What to measure Determining paths users take to reach your information • Can help assess useability of site • Find out what’s most (and least) popular on your site • For very busy sites, can be used in real time to balance traffic loads and prevent overwhelming servers. • Used in “funnel analysis” (more on this later)
- What to measure Key term used in user-path monitoring • “Click path” • What pages a particular visitor follows during a particular session. • Related to “site overlay” view in Google Analytics showing web pages with number of clicks overlaid on each link (totals for a subset of visitors)
- What to measure Determining whether users are going where you want them go and doing what you want them to do • Very much a sales/marketing approach • Definitely applicable to outreach and fundraising, and possibly to media work(??) • Require extra staff time & expertise • “Event” analysis • How many users successfully downloaded the video from your last release? • “Funnel” analysis • What steps did each user have to take to find and download this video? (details later)
- What to measure Measuring trends over time • Comparing different web metrics is like comparing apples, oranges, bananas, and cumquats (there is no standard) • Trends over time may be more reliable and accurate than absolute numbers
4. How to measure • News release exposure • Internal web site traffic • Facebook • YouTube • Twitter
- How to measure How to measurenews release exposure • Traditional methods – clipping services (paper and on-line), Vocus multimedia monitoring, Eurekalert • On-line searches (e.g. Google News) • Advanced searches (unique words, blogs, Twitter searches, etc.) • Can measure number of original articles and (increasingly) verbatim reprints of releases • Can sometimes estimate “reach” of “publisher” (e.g. number of blog readers) • Can use various on-line tools for calculating “buzz”
- How to measure How to measureinternal web traffic • Method 1: “Server log files” • Software running on your web server counts every page and file that is sent out to each IP address • Data are stored locally in a format available to you and your server administrators • Not tied to a specific vendor • Downside: Doesn’t count cached pages (pages sent once to user’s site, but stored and re-used) • Downside: May requires staff time, storage space • Downside: Useful for server admins, but less so for marketing/PIO types
- How to measure How to measureinternal web traffic • Method 2: “Page tagging” • Small Javascript code added to every web page on site (easiest to do in a common header or footer). • Sometimes combined with tracking cookies or persistent code in Flash (not easily deleteable like cookies) • Information from Javascript code is sent to outside server (e.g. Google Analytics) • Counts cached pages and allows customized scripts to collect specific information about visitor behavior (e.g. time on page) • Downside: A few users disable Javascript; many more delete cookies; only latest mobile phones support these. • Has become de-facto standard
- How to measure Comparing server logging and page tagging • Example: MBARI web stats Jan-April 2011, based on Google Analytics and freeware program Web Log Expert: But trends are nearly identical:
- How to measure Google Analytics • The most widespread tool for web monitoring (Google claims that well over 50% of the largest web sites use Google analytics) • Easy to use at basic level (and free if you have a gmail account) • Very customizable for the advanced user • Becoming increasingly oriented toward marketing and sales vs simple tracking
- How to measure Google Analytics –How it works • A “page tagging” system that uses both Javascript and cookies • A bit of Javascript called the Google Analytics Tracking Code (GATC) is added to every page of a web site. • The code sends messages back to Google each time that page is loaded into a browser. • Google creates a single file about a user’s computer (based on its IP address) that sends information to Google about when they visited every page on that site, AS WELL AS any other sites that use Google Analytics. • The code also stored cookies on the user’s computer that show whether the visitor has been to the site before, the time of the visit, the web site that the user came from, as well as any search terms used.
- How to measure Google Analytics –How to use it (very briefly) • (Open GA for MBARI’s web site) • Dashboard – Overview of “big picture” site metrics (customizable) • Intelligence – Set custom “events” for which you want to be notified (e.g. big rise or drop in traffic) • Visitors – Demographics, “loyalty,” browsers used, etc. • Traffic Sources – Find out who’s linking to you • Content – Find out where people are going (and drill down to see individual pages) • Site search – Find out how people find you in searches (search terms, etc.)
- How to measure Google Analytics –How to use it (continued) • Event tracking – Marketing/sales oriented options for the advanced user • Goals – Find out if people are doing things you want them to do (e.g. successfully completing a form or downloading a file) • Custom Reporting– Allows advanced users to graph/output combinations of stats listed above
- How to measure Google Analytics –A few tips • Add annotations of events such as news releases. • Can track down sources of spikes to specific web sites (select a SINGLE day) • If you do see a source that drives traffic (and is reputable), try contacting them to get them on your email list, or as a Twitter follower • Customize the dashboard to show key stats you want to compare each time you log in. • Others from the audience?
- How to measure Other free web tracking tools • There’s a bazillion of them… • Quantcast.com (standard page tagging) • Compete.com (ranking w/other sites) • Sharethis.com (counts people linking via a variety of social networks)
- How to measure Metrics for Facebook • Use Facebook “Insights” pages to track: • Changes in the number of people who “Like” your site over time • Demographics (applies to Facebook members only; not all viewers)
- How to measure Metrics for Facebook • Example of “Likes” tracking
- How to measure Metrics for YouTube • Can measure: • Number of views • Demographics (only covers YouTube members who are logged in)
- How to measure Metrics for Twitter • There are a bazillion services out there, but I don’t have a specific one to recommend. • Does anyone have experience with them? (audience comment - bit.ly seems to be popular)
5. Putting it all together(ideas and examples) • MBARI experiences • Experiences from other active users of social media • Tips and techniques from marketing types • Caveats
- Putting it all together MBARI news releases – effects on direct web traffic • Visitors to news release page spikes within one or two days of release, then tapers for a couple of weeks: • For example, Rappemonads release started at 165 unique visitors /day then tapered to 15-30/day over next week; 5-10/day after that. • Older 2010 releases get only 3-7 unique visitors/day • Biggest hits are from releases featuring weird animal photos: For example, the barreleye release averages 125 unique visitors / day; these pages are very spikey depending on when random bloggers discover the page.
- Putting it all together News release monitoring example:rappemonads (a new type of algae) • Release didn’t get much mainstream media coverage, but it did get wide pickup in news aggregation sites and blogs • Because the name of the algae had never appeared in the literature before, a simple Google search (not in News) turned up dozens of sites that used the release more or less verbatim • Based on slight differences in wording, I was able to track the “flow” of information from my email release, our web site (probably rss feed), and Eurekalert • Some blogs show where they got the text, as well as number of views, retweets, etc. • The amount of secondary coverage is impressive
- Putting it all together News release monitoring example:tracking a key term
- Putting it all together News release monitoring example:tracking a key term (continued)
- Putting it all together MBARI Web-site monitoring example • Goals: • Increase general awareness of MBARI research • Provide detailed information about MBARI research for the general public and press. • Implementation: • New articles or photos posted about once every week or sometimes 2 weeks • One staff person spending 8+ hours/week
- Putting it all together MBARI Web-site monitoring example • Use both server logging and GA (see previous comparison chart) • News site receives relatively low overall numbers of viewers (a few hundred a day) • Because of low overall visitor numbers to our news site, any bump of 50-100 visitors/day can make a big impact on our overall traffic. • Bumps may be due to class assignments and outside links from large aggregator or news sites • Low retention because they just want to see a particular image or video on the site
- Putting it all together MBARI Web-site monitoring example
- Putting it all together MBARI evaluation of potentialfor Facebook exposure • There is a relationship between frequency of postings and number of “Likes.” However, it may not be cause and effect, but covariance with other variables, such as general outreach effort.
- Putting it all together MBARI Facebook monitoring example • Goals: • Increase general awareness of MBARI • Drive traffic to our main web site • Share info about general marine topics (not just MBARI) • Implementation: • Set up page Feb 8, 2011 • Posted about 20-25 times a month so far • One staff person spending 1-2 hour/week*
- Putting it all together MBARI Facebook monitoring example • Tracking “Likes”: Early exponential increase now leveling off • Very event-driven increase (e.g. push from Aquarium) • Suggests we need to make more effort to get more “Likes” if we want to get more “likes.”