Effectiveness Metrics for the Web
Effectiveness Metrics for the Web. Prepared for the University of Washington May 17 th , 2001. What Will We Be Discussing Today?. Overview of Online Metrics Measuring Web Site Effectiveness Wells Fargo Case Study Cap’n Crunch Case Study Q&A. Introduction.

Effectiveness Metrics for the Web
E N D
Presentation Transcript
Effectiveness Metrics for the Web Prepared for the University of Washington May 17th, 2001
What Will We Be Discussing Today? • Overview of Online Metrics • Measuring Web Site Effectiveness • Wells Fargo Case Study • Cap’n Crunch Case Study • Q&A Introduction
What is the Value of Online Metrics? • Prove the value of a campaign/initiative • Evolve your campaigns, products, etc. • Understand your users better • Forecast and respond to trends • Uncover new business opportunities Online Metrics – Art vs. Science
The Art & Science of Measuring Effectiveness • User-Centric • Results Oriented • Seek Affirmation Perspective Process Tools • Web Reporting Tools • Campaign Tracking • Sales Data • Dynamic Marketing • Online Focus Grouping • Surveys • Periodic Analyses Online Metrics – Art vs. Science
User Experience (UXP) is: Whatever the user sees, thinks, or feels in the interaction with a brand, product, or company. The UXP is an accumulation of interactions through Web, brick and mortar, call center, wireless, direct marketing, kiosks, DITV, PDAs, etc. The UXP should drive transactions, learn from the customer, and positively impact brand perception UXP is successful through understanding expectations, quality of execution, and ability to adapt quickly to ever-changing user needs. User Attraction Expectations Goals Transactions Customer Insight Brand Impact The User Experience Environment Functionality Content Business Online Metrics – Art vs. Science
DareStep Perspective on Evaluating Web Site Effectiveness Site Diagnostics Professionals Online Focus Groups Real Users Natural Language Query and Search Technology Web Reporting & Analysis - eMetrics Technology & Process Setting Performance Models and Driving Business Value Our View on Measuring Web Effectiveness
Site Diagnostics: Evaluation Criteria Content: text, images, and multimedia content Brand Impact: consistent message and visual representation of brand Functionality: such as transactional capabilities, personalization, etc. Information Architecture: structure of the site, navigation, and labeling Marketing: can users easily find the site? Are their expectations set correctly? Community: social interaction and creation of intellectual capital like customer book reviews Design: effectiveness of the visual layout, use of color, type, image, etc., in conveying the brand image and enabling users to accomplish their goals Our View on Measuring Web Effectiveness
Site Diagnostics: Evaluation Criteria Consumer Confidence: will users trust this site to do business? Includes security, privacy, credibility, and reliability Support: What kinds of support (email, phone, etc.) are available and how effective are they? Usability: how easy is it for users to accomplish their tasks? Our View on Measuring Web Effectiveness
Online Focus Groups: Methodology Testers login from natural Web setting Invite sample of testers Testers evaluate site(s) • Natural setting • Minimize “demand characteristics” • Anonymity encourages candor • Target customer profile • Large sample size • Panel proactively managed • Intent-based context • Expectations and interaction interpreted together • Objective and subjective indicators Our View on Measuring Web Effectiveness
Online Focus Groups: User Response Our View on Measuring Web Effectiveness
Natural Language: Query and Search • Natural Language Input (Query /Search) - Responses tailored to explicit Query and Search - Enhancement Opportunities for Knowledge Base - Improved perception of customer service • Keyword Search • - Access through Indexed Content Management • Service Effectiveness Measures / User Experience - Percent Questions Answered Correctly - Speed to Correct Response - Content Gaps – Enhancement Opportunities Our View on Measuring Web Effectiveness
Web Reporting & Analysis: eMetrics • Site Analysis: Operations & Design • Volume and Capacity Planning • Response Time and Latency • Dead Ends – Content Augmentation – Link Integrity • Customer Analysis: User Behavior & History • Customer Profiles • Behavioral • Lifetime Value Analysis • Business Analysis: Financial & Marketing • Return on Investment • Campaign and Partnership Effectiveness • Cost of Business and Efficiencies Our View on Measuring Web Effectiveness
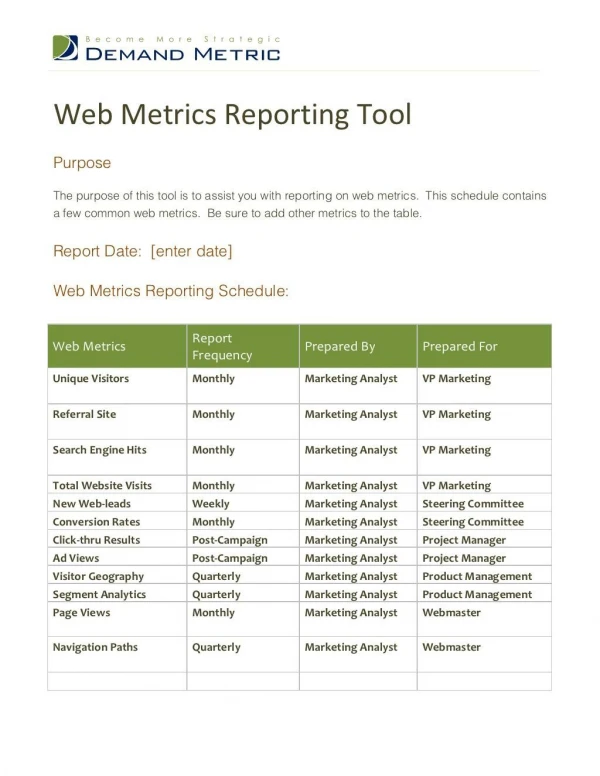
Web Reporting & Analysis: Range of Reports • Basic Reports – Metrics based on traffic data • eBusiness Reports – Reports based on integrated traffic data, transactional data, registration data, email • Behavioral Profile Reports – Reports generating customer profiles and segmentation, based on integrated traffic data, transactional data, registration data, email Our View on Measuring Web Effectiveness
Web Reporting & Analysis: Basic Report • Basic report category is fundamental to all business functions and forms the building block of Web Site Analysis. • Types of reports: • Hits • Page views • Visits • Click-through • URL of origin Source: NetGenesis Our View on Measuring Web Effectiveness
Web Reporting & Analysis: eBusiness Report • eBusiness report category uses various data to depict visitor activity on the Web, and is increasingly required to support higher level of business. • Types of reports: • Conversion rate • Customer Lifetime value • ROI reports • Site performance Source: NetGenesis Our View on Measuring Web Effectiveness
1,200,500 Visitors accessed the Everyday Law site 85.7% Never Entered Registration Page 171,511 (14.3 %) Entered Registration Page Registration Process Step 1 100% 35.5% Dropout at Step 1 Step 2 110,636 (9.2% ) Reached Step 2 64.5% 12.4% Dropout at Step 2 Step 3 96,913 (8.1 %) Reached Step 3 56.5% 25.7% Dropout at Step 3 Confirmed 72,035 (6.0% ) Registered 42.1% 57.9% Abandoned the Registration Process Web Reporting & Analysis: eBusiness Report • eBusiness report category uses pre-generated segmentation of identified visitors, to answers higher level business questions. • Types of reports: • Visitor form abandonment • Visitor shopping cart abandonment • Repeat purchasers • Repeat items purchased by type of visitor Source: Personify Our View on Measuring Web Effectiveness
Web Reporting & Analysis: Behavioral Profile Report Source: Personify How many visitors who viewed the different content areas also subscribed to the Newsletter? Our View on Measuring Web Effectiveness
Wells Fargo’s Objectives • Convert existing customers to online banking and bill payment • Engage account holders in other relationships with the bank • Lower the costs of mining customer relationships and building new accounts Case Study: Wells Fargo
Approach • Establish an ad serving system to track the delivery and effectiveness of campaigns • Capture the “low hanging fruit” – target existing account holders with high internet usage on their favorite sites • Target potential and existing customers on lifestyle sites and on wellsfargo.com Case Study: Wells Fargo
Potential Metrics? • Click through rates • Total Accounts • Cost per click (CPM + Agency Costs) • Cost per transaction • Cost per new account • Potential total customer value Case Study: Wells Fargo
Wells Fargo: Execution User Sees Banner on Web Brand Impression # of views # of apps # of returns User Clicks Through (cookied) # of clicks # of visits, time User Visits Landing Page User Fills Out Application # of exits User Exits – Browses Elsewhere Case Study: Wells Fargo
Wells Fargo: Execution Old Banner Creative Champion • Average Click-through rate of 0.x% • y number of applications per month • z number of “branded impressions” New Banner Creative Challenger • Same average click-through rate • ~10% higher number of applications per month • ~20% higher “branded impressions” Case Study: Wells Fargo
Wells Fargo: Execution Old Style Creative Champion • Average click-through rate of 0.x% New Style Creative Challenger • ~10% higher click-through rate Case Study: Wells Fargo
Wells Fargo: Execution Banner Creative 468x60 160x40 Landing Page Case Study: Wells Fargo
Overall Results • Installed Campaign Management tools - adapted creative, placements on the fly • Optimized campaigns for optimal results, resulting in a lower cost-per-transaction • Drove considerably higher numbers of new accounts across all products Case Study: Wells Fargo
Cap’n Crunch’s Objectives • Create brand relevancy with the 9-12 year old market • Invigorate the aging brand and create a sense of excitement among youth • Increase sales with new customers • Recapture market share Case Study: Cap’n Crunch
Cap’n Crunch: Approach Case Study: Cap’n Crunch
Potential Metrics? • Page Views • Time Spent on Site • Registration • Clue Entries / Offline Interactions • Sales • Branding Value Case Study: Cap’n Crunch
Cap’n Crunch: Campaign Highlights Case Study: Cap’n Crunch
Cap’n Crunch: Campaign Highlights Case Study: Cap’n Crunch
Cap’n Crunch: Campaign Highlights Case Study: Cap’n Crunch
Cap’n Crunch: Campaign Highlights Case Study: Cap’n Crunch
Overall Results • Week 1 gave us 600,000 impressions, 70,000 user sessions • After the first half of the campaign, the web site recorded: • - 4 million impressions • - 500,000 user sessions • - 100,000 registered users • Quaker beat their projected sales Case Study: Wells Fargo
Overall Results • Avg. time on Disney’s site: 15 min. • Avg. time on Nickelodeon’s site: 19 min. • Avg, time on Cap’n Crunch: 20 min. • Kids see an average of 10 – 20 ads per year, for a total of 10 minutes of exposure to the brand – the web far outpaced old media Case Study: Wells Fargo
Overall Results • 7MM CD-ROMs distributed in special packs • Avg. play time of 5-7 hours (initial) • Cap’n Crunch increased their market share from 2% to 4.5% (previous promo increased share by 1%) Case Study: Wells Fargo