Download
1 / 18
180 likes | 205 Vues
Study on Delaware Bay's beaches hosting annual horseshoe crab spawning, mapping shoreline factors affecting crab habitats, and threats to beach viability and shorebird feeding areas. Methods include GIS analysis, habitat models, and wind/wave disturbance assessments. Conclusion highlights high-quality habitat percentages and future challenges due to sea-level rise and erosion.

E N D
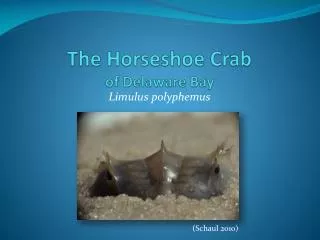
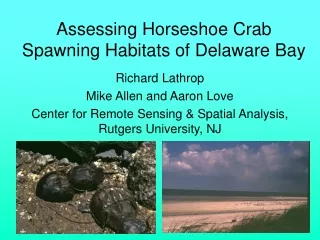
Assessing Horseshoe Crab Spawning Habitats of Delaware Bay Richard Lathrop Mike Allen and Aaron Love Center for Remote Sensing & Spatial Analysis, Rutgers University, NJ
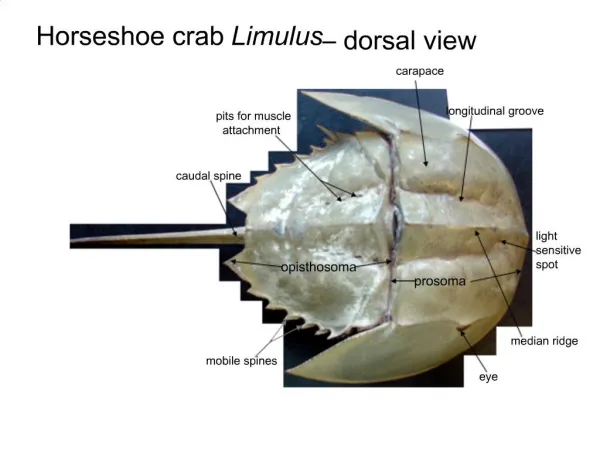
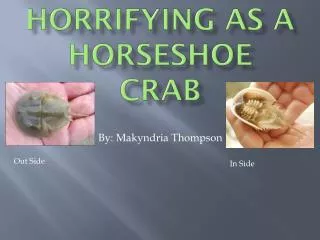
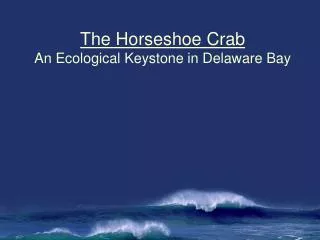
Delaware Bay USA is host to an annual rite of late spring when multitudes of horseshoe crabs (Limulus polyphemus)come to mate and spawn on its beaches. In turn, flocks of shorebirds and gulls come to feast on the bonanza of crab eggs. In the short-term, this spectacle of nature has been threatened by over-harvesting of horseshoe crabs. In the long term, the viability of Delaware Bay’s beaches as prime spawning habitat needs to be sustained and restored.
Long term threats to the Delaware Bay shoreline and crab spawning beaches Disappearing beaches due to the combined effects of sea level rise, beach erosion and inappropriate shoreline development Beach armoring cuts the crabs off from the beach and possible spawning habitat
Project Objectives • To map and characterize Delaware Bay shoreline on both the New Jersey and Delaware sides • To assess site specific and landscape factors that impact a beach’s suitability as horseshoe crab spawning habitat • To identify factors that threaten the short- and long-term viability of the beaches as spawning and shorebird feeding habitats
Mapping Methods: • On-screen interpretation of high resolution (sub-foot) digital color infrared aerial ortho-photography (acquired 2002) • Digitization for input to a GIS for analysis and display • Mapping fore-shore vs. back-beach beach type, obstructions • and adjacent land use • Beach width
Classification of Shoreline types • Sand Beach • Mud/Peat Beach • Salt Marsh • Bulkhead/Armoring
Habitat Suitability Model • Applied the prior work of Marc Botton and Bob Loveland to classify beach composition type into 5 categories of horseshoe crab suitability • Optimal: undisturbed sand beach; • Suitable: sand beach with only small areas of peat and/or • backed by development • Less Suitable habitat with exposed peat in the lower and • middle intertidal zone and sand present in the upper • intertidal; • Avoided habitat with exposed peat or active salt marsh • fringing the shoreline, no sand present • Disturbed due to beach fill, riprap or bulkheading Botton et al. 1988. Beach erosion and geochemical factors: influence on spawning success of horseshoe crabs (Limulus polyphemus) in Delaware Bay. Marine Biology 99:325-332
Comparison of Habitat Suitability and Spawning Activity data • U.S. Geological Survey Horseshoe Crab Beach Survey Index of Spawning Activity (ISA) data SPAWNAR databasehttp://www.lsc.usgs.gov/aeb/2065/SPAWNAR/index.asp • USGS surveyed only sand beaches, did not surveys shoreline dominated by salt marsh/eroded peat (i.e., Avoided category).
Sea Breeze NJ USGS Index of Spawning Activity beach transect (in red) overtop the 2002 CIR DOQ imagery (scale 1:1,000). Note the sand mixed with coarse beach fill and the boulders and concrete rubble on the backbeach.
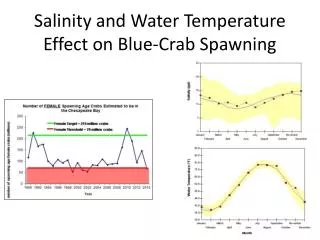
Wind/Wave Energy Disturbance Wind fetch was used as a measure of wind/wave disturbance. Wind fetch was calculated using the USCOE Shore Protection model that employs an average of 9 radials (3° separation) around the axis of wind origin. (Spawning Months) Fetch calculations were based on average wind direction (by month) for a 30 year record from Dover Air Force Base, Delaware (National Climatic Data Center, www.ncdc.noaa.gov). Ignored wind speed.
Conclusions • Approximately 30% of the Delaware Bay shoreline was classified as high quality (i.e., Optimal or Suitable) horseshoe crab spawning habitat. • No discernable relationship between the mapped habitat suitability class and ISA. Exactly what physical and biological conditions constitute “optimal” beach habitat is still unclear. • Significant amounts of otherwise high quality beach habitat may be compromised by high wind/wave exposure that may modify the beach morphology or directly inhibit crab spawning activity. • Sea level rise and shoreline erosion is expected to continue into the future and will alter the present availability of high quality beach habitat.
Acknowledgments • This project was done in collaboration with the American Littoral Society with special thanks to Tim Dillingham • Thank the students who have helped in the mapping: Carl Figueirido, Ishaani Sen, Bernie Isaacson • John Bognar has been critical in the overall project database management • David Smith and Penelope Pooler of the USGS and Virginia Tech University provided the coordinates for the USGS ISA beach transect sampling locations. • Funding provided by the Regina Frankenburg Fund and the Mushett Family Foundation • For a pdf copy of the report go to: http://crssa.rutgers.edu/projects/delbay/
For a pdf copy of the report go to: http://crssa.rutgers.edu/projects/delbay/