Benefit Cost Analysis For Intersection Driver Support Systems
This study provides a comprehensive benefit-cost analysis of intersection driver support systems, focusing on affected groups in highway engineering. It compares existing safety countermeasures at unsignalized intersections with alternative solutions that integrate advanced traffic engineering technologies. The analysis examines various intersection types, approach characteristics, and relevant technologies—including sensors, communication systems, and display devices. It assesses costs, benefits, and the net present value for service providers, users, and the community, aiming to improve safety and traffic efficiency at critical intersections.

Benefit Cost Analysis For Intersection Driver Support Systems
E N D
Presentation Transcript
Benefit Cost Analysis For Intersection Driver Support Systems David Levinson& Xi Zou 2004
Highway Engineering Countermeasures Sight distance Split Intersection Roundabout Right-turn Lanes Left-turn Lanes Channelization Number of intersection legs Intersection types Approach Characteristics Median Alignment of approaches Identify Relevant Technologies • Traffic Engineering Countermeasures • Type of Traffic Control • Posted Speed Limit • Lighting • Advanced Warning Signs
Framework of Benefit Cost Analysis • The Base Case for the comparison is the existing safety countermeasures at unsignalized intersections. • Two majoralternative scenarios of development will be examined: • The combination of highway engineering countermeasures • The countermeasure developed in the IDS project.
Framework of Benefit Cost Analysis NPV: Net Present Value
Costs & BenefitstoService Provider, Users and Community Costs to Service Provider, Users and Community
Major Components: Computer systems: Industrial PC Communication system: wire, fiber optic or wireless Sensors: Radar Lidar (Light Detection And Ranging) Vision: visible and infrared cameras Display devices: For pole system, lights and poles are needed. For message signs, panel display devices and poles are needed. For beacon system, only beacons (installed with traffic signs) are needed. Traffic signs Power units Estimate Lifespan of Technology
Example: Sensor system: Radar (Major), 10 yrs Lidar (Minor) 10 yrs Computing and communication system: PC 5-10 yrs Wired communication 20 yrs Wireless 10yrs Display: 2x2 LED panels 50,000 hrs Traffic signs: 2 Stop signs with signage 20 yrs Estimate Lifespan of Technology
Example: Display: 2 LED panels $5-8k Traffic signs: 2 Stop signs $150 + $60 labor Sensors & Communication: See Next Page Maintenance costs: Power consumption: Estimate Costs of Technology
Reference Shankwitz 2004
Recommended Standard Values in FY 2004, Mn/DOT Discount Rate 3.5% Auto Time Value $10.04 per person per hour Truck Driver Time Value $18.61 per person per hour Auto Variable Operating Cost $ 0.28 per mile Truck Variable Operating Cost $ 1.45 per mile Estimate Benefits of Countermeasures
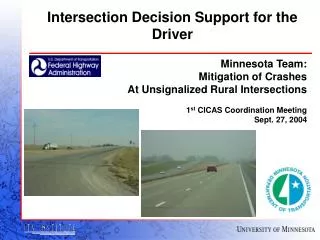
Estimate Benefits of Countermeasures: Travel Time Savings • Traffic on Highway 52 near the intersection of TH 52 and MN CSAH9 in Goodhue County: • Average Annual Daily Traffic: 25700Heavy Commercial Traffic: 2850Source: State of Minnesota 2002 Truck Highway Traffic Volume Map, Office of Transportation Data and Analysis, Mn/DOT • Need to know: Time saving (if existing) in hours (obtained from data collection and simulation)
Abbreviated Injury Scale (AIS) is an anatomically based system that classifies individual injuries by body region on a six point ordinal scale of risk to life. The maximum AIS (MAIS) is the highest single AIS code for an occupant with multiple injuries. Estimate Benefits of Countermeasures
Value of life $ 3,000,000 (FHWA DOT, Sept. 2003) Costs of injuries (2000 Dollars, NHTSA): PDO: $ 2,532 $ 2,256 MAIS 0: $ 1,962 $ 1,748 MAIS 1: $ 15,017 $ 13,383 MAIS 2: $ 157,958 $ 140,766 MAIS 3: $ 314,204 $ 280,007 MAIS 4: $ 731,580 $ 651,957 MAIS 5: $ 2,402,997 $ 2,141,462 Fatal: $ 3,366,388 $ 3,000,000 Estimate Benefits of Countermeasures
At the intersection of TH 52 and CSAH 9, 23 accidents are in the police report from 01/01/2000 to 12/31/2002. The severities of these accidents are: 1 A level ($ 260,000, Mn/DOT) 10 B level ($ 56,000, Mn/DOT) 6 C level ($ 27,000, Mn/DOT) 6 N level ($ 4,000, Mn/DOT) Total cost is $ 1,006,000 (1997 Dollar)or $1,156,900 (Current Dollar) Or ranges from $2,083,641 to $ 5,035,366 (2003, FHWA DOT) Social benefits: Life and property savings by reducing crashes. Need to know: reduction in the number of crashes and reduction in the severity of crashes. Estimate Benefits of Countermeasures: Crash Savings
Estimate Benefits of Countermeasures: Remaining Value • Recommended Remaining Capital Value factors for Use in Economic Analysis in FY 2004 (Ref. 2) • Expected Life (yrs) (Ref. 2)
Inflation of Dollars • 2003 Dollar • $ 1.1462 1997 Dollar • Current Dollar • $1.15 1997 Dollar • Source: • http://inflationdata.com/inflation/Inflation_Rate/HistoricalInflation.aspx
Values Used in Benefit Calculation (Miller) • Comprehensive Costs by Severity of Accident • Accident Severity Cost Per Person Cost Per Crash • K-Fatal $2,392,742 $2,722,548 • A-Incapacitating $169,506 $228,568 • B-Evident $33,227 $48,333 • C-Possible $17,029 $25,288 • O-Property Damage $1,734 $4,489 • Unreported $1,601 $4,144 • A-B-C reported nonfatal $46,355 $69,592 • K-A-B-C reported injury $77,153 $115,767 • Source: Miller 1991 (p39)Note: assuming 1988 dollars and 4% discount rate
C1: Identify relevant technologies, Review of Literature. C2: Develop Benefit Cost Framework. C3: Estimate Lifespan of Technology. C4: Estimate Costs of technology. C5: Estimate Benefits of Countermeasures. C6: Lifecycle Analysis. C7: Recommend Countermeasures. C8: Analyze Inter-technology Effects. C9: Determine Performance Metrics. C10: Develop cost:performance models. C11: Analyze Synergies. C12: Optimize Counter-measure Combination. Subtasks
Benefit Cost Analysis: Concept A benefit/cost analysis evaluates the advantages (benefits) and disadvantages (costs) of transportation investment alternatives by comparing their benefit-cost ratio. Major Benefits: Reducing likelihood of crashes, reducing travel time, and vehicle operating costs. Major Costs: Initial capital investment and maintenance costs.
Major References: FHWA (2004) Equipment Costs for Roadside Detection (RS-D), ITS Benefits and Costs Database. FHWA (1996) National ITS Architecture Cost Analysis, prepared by the Architecture Development Team. Task 3: Estimate Lifespan of Technology
Task 4: Estimate Costs of Technology Major Reference: 1. National ITS Architecture Cost Analysis (FHWA, 1996), prepared by the Architecture Development Team. The costs of ITS elements in this document are based primarily on the unit costs in: • The National ITS Architecture Cost Analysis (FHWA 1996) and • The ITS Deployment Analysis System (IDAS) equipment list. IDASis software developed by the Federal Highway Administration for ITS planning and cost/benefit analysis. 2. Quotation No. 1251 by Shane Electric, Inc. to University of Minnesota on Highway 52 Project. 3. Abby McKenzie, Benefit /Cost Analysis for Transportation Projects (per Minnesota Laws 2001, Chapter 10, Article 2, Section 41), Mn/DOT office of Investment Management Statewide Planning and Analysis.
Major Reference: Abby McKenzie, Benefit /Cost Analysis for Transportation Projects (per Minnesota Laws 2001, Chapter 10, Article 2, Section 41), Mn/DOT office of Investment Management Statewide Planning and Analysis. Task 5: Estimate Benefits of Countermeasures
Major Reference: Lockheed Martin Federal Systems, Odetics Intelligent Transportation Systems Division (1997), ITS Cost Analysis, prepared for FHWA, DOT. Task 6:Lifecycle Analysis
C7: Recommend Countermeasures. C8: Analyze Inter-technology Effects. C9: Determine Performance Metrics. C10: Develop cost:performance models. C11: Analyze Synergies. C12: Optimize Countermeasure Combination. Ongoing Tasks
Task 4: Estimate Costs of Technology Itemized Costs of Highway 52 Project • Annualized Cost Assumed Service Life 20 Years Annual Capital Recovery Cost x Power x Communication x Maintenance x Total Annual Cost x