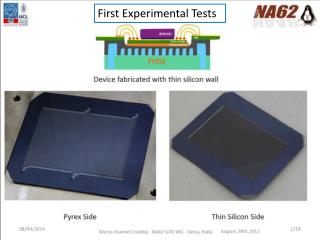
First Experimental Tests
This study presents experimental tests and CFD simulations investigating the thermal performance of temperature sensors using Pyrex and Araldite 2020 materials. The setup simulates conditions with various inlet temperatures and power levels while employing specific silicon sensors across chip configurations. Key findings indicate discrepancies between experimental and simulated data, attributed to factors like sensor inaccuracies and environmental heat exchange. Recommendations for improving future tests include enhancing sensor calibration and control over power supply, setting the stage for further refinement in thermal management solutions.

First Experimental Tests
E N D
Presentation Transcript
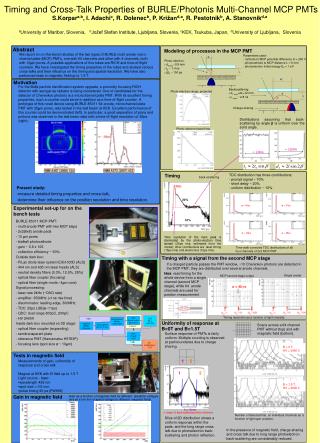
First Experimental Tests Temperature sensors
First Experimental Tests • Differences with the final configuration: • Pyrex • Araldite 2020 • Heaters to simulate the 10 read out chips Baseline Device #031 + Si Heater #31112 5 4 3 2 1 10 9 8 7 6 • 15 Temperature sensors: • 5 on the Silicon Sensor • 5 on the chips (“left side”) • 5 on the chips (“right side”) 15 14 13 12 11
CFD Simulations 2 microchannels Pyrex ρ = 2.23 g/cm3; Cp = 0.84 kJ/kgK; k= 1.4 W/mK, s=0.525 mm Araldite 2020 ρ= 1.1 g/cm3; Cp = 1.9 kJ/kgK; k= 0.3 W/mK, s= ? (0.03 mm) Silicon (Sensor/Microch.) ρ= 2.33 g/cm3; Cp = 0.7 kJ/kgK; k= 148 W/mK, s= 0.2 mm) Cooling Fluid (FC72) ρ= 1.68 g/cm3; Cp = 1.1 kJ/kgK; k= 0.057 W/mK)
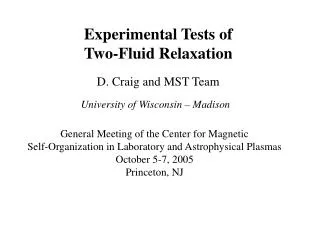
Comparison between CFD Simulation and Experimental Tests Experimental Tests CFD simulations Nominal Power TIN = -20°C TIN = -25°C TIN= -30°C TIN = -20°C TIN = -25°C TIN= -30°C Mass Flow = 8g/s
Comparison between CFD Simulation and Experimental Tests TIN = -20°C Experimental Tests Tstand_IN TIN = -25°C 5 4 3 2 1 TIN = -30°C 10 9 8 7 6 Tstand_OUT 15 14 13 12 11
Comparison between CFD Simulation and Experimental Tests TIN = -20°C TIN = -25°C TIN = -30°C CFD simulations Si Sensor Chip_Sx Chip_Dx Inlet Same inlet temperature of the Exp. Tests Pyrex
T Note: coarse evaluation of the exp. tests error
After PT100 calibration • Good similarity – Exp. and CFD results • Difference especially for the 2nd chip (chip_dx) and the sensor
Differences may be due to: • Errors in the evaluation of the thickness of the araldite layers • Variation of the mass flow rate and errors in the evaluation of the corresponding flow velocity • Presence of heat exchange with the environment (convection and radiation) that is neglected in the model • Variation of the chips heating power • Inaccuracy in the temperature sensors
Differences may be due to: • Errors in the evaluation of the thickness of the araldite layers • Variation of the mass flow rate and errors in the evaluation of the corresponding flow velocity The simulation were repeated for different thickness and mass flow rate negligible differences were observed
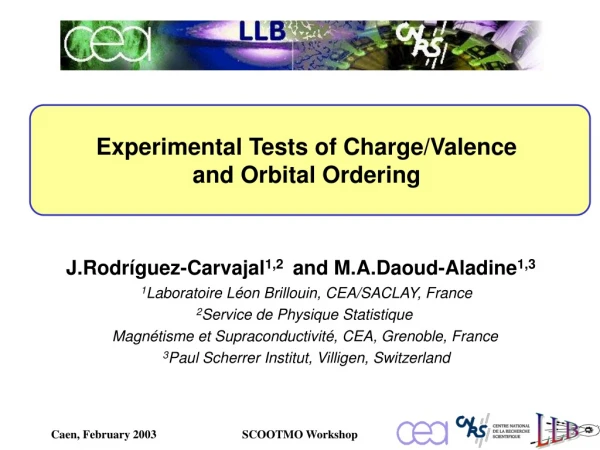
Differences may be due to: • Presence of heat exchange with the environment (convection and radiation) that is neglected in the model • Variation of the chips heating power • Test repeated for a chosen Power-Temperature condition with convection and varying the heating power of the EoC (Digital)
Influence mainly on the “2nd part” also when only convection is introduced The introduction of the convection heat transfer improves the similarity with the experimental results A small difference on the power supply correspond to a significant difference in temperature - an increase of 10% of power supply (22.13W instead of 20.12W) correspond to a temperature difference over the chip about one degree
Constant value of power supply difficult to reach Min = 19.21 W Max = 21.24 W Δ = 2.03 W Min = -0.005 Max = 0.005 Δ = 0.010 Min = 39.31 W Max = 42.08 W Δ = 2.78 W Min = 2.04 W Max = 4.72 W Δ = 2.68 W Min = -0.001 Max = 0.001 Δ = 0.020 Min = 7.83 W Max = 4.49 W Δ = 3.34 W
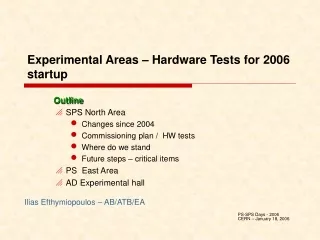
Temperature distribution over the Si Sensor Note: values for T=-20°C and Nominal Power Similar temperature distribution are achieved with the other test conditions Temperature difference over the sensor of 1.7°C Good uniformity
Note: values for T=-20°C and Nominal Power Similar temperature distribution are achieved with the other test conditions Sensor ΔT=1.7°C Same temperature on the bottom surface The temperature varies significantly along the section The exact position of the temperature sensors is important EoC Chip sx ΔT = 1.5 °C EoCChip dx ΔT = 3.6 °C
Improvement suggested for the following experimental tests: • Higher accuracy in the temperature sensors calibration • Better control of the power supply • Note the exact position of the sensors • Note ambient temperature for the evaluation of the heat transfer toward the environment • […]
Future plans: • Setup of the CFD simulation for the real prototype • Both final models will be shared on the server with a reference technical note