Download
1 / 1
10 likes | 134 Vues
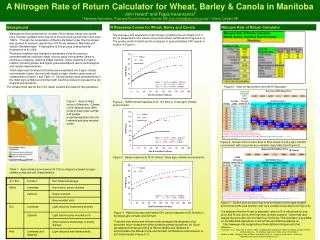
Moist: Y = 25.75 + 0.4902x – 0.0015x 2 Dry: Y = 14.22 + 0.4159x – 0.0013x 2 Arid: Y = 14.22 + 0.5464x – 0.0038x 2. Figure 2. CWRS wheat response to N; 147 sites in three agro-climatic environments. Moist: Y = 34.75 + 1.152x – 0.0037x 2 Dry: Y = 31.73 + 1.556x – 0.0082x 2

E N D
Moist: Y = 25.75 + 0.4902x – 0.0015x2 Dry: Y = 14.22 + 0.4159x – 0.0013x2 Arid: Y = 14.22 + 0.5464x – 0.0038x2 Figure 2. CWRS wheat response to N; 147 sites in three agro-climatic environments Moist: Y = 34.75 + 1.152x – 0.0037x2 Dry: Y = 31.73 + 1.556x – 0.0082x2 Arid: Y = 23.93 + 0.671x – 0.0032x2 Figure 6. Screen shot of return $/ac to N for wheat in a dry agro-climatic environment with crop price as a variable (input data from Figure 5). ($/t urea) Figure 3. Barley response to N; 97 sites in three agro-climatic environments. Hybrid: Y = 25.9 + 0.232x – 0.0005x2 OP: Y = 18.3 + 0.280x – 0.0009x2 Background N Response Curves for Wheat, Barley and Canola Nitrogen Rate of Return Calculator Manitoba fertilizer guidelines for nitrogen (N) on wheat, barley and canola have not been updated since closure of the provincial soil test lab in the early 1990’s. Through the cooperation of Westco Fertilizers (now Viterra) access was granted to research results from 278 N rate studies in Manitoba and eastern Saskatchewan. A description of this process is described by Karamanos et al, 2009. Production systems had changed considerably since the previous recommendations had been made: moving away from summer fallow to continuous cropping, reducing tillage intensity, higher diversity of crops in rotation, including pulses and higher yield expectations due to technological and varietal improvements. Yield responses for wheat and barley were separated into 3 agro-climatic environments (moist, dry and arid) based on agro-climatic zones and soil characteristics (Figure 1 and Table 1). Canola studies were predominantly in the moist agro-climatic environment with insufficient sites to represent the dry and arid environments. The nitrate-N soil test for the 0-24” depth remains the basis for the guidelines. The average yield response to total nitrogen (fertilizer plus soil nitrate-N in 0-24”) is presented for the various crop-environment combinations (Figures 2-4). The greater yield of hybrid canola compared to open pollinated (OP) canola is evident in Figure 4. A Nitrogen Rate of Return Calculator for Wheat, Barley & Canola in ManitobaJohn Heard1 and Rigas Karamanos21 Manitoba Agriculture, Food and Rural Initiatives, Carman MB John.Heard@gov.mb.ca and 2 Viterra, Calgary AB Figure 5. View of input screen from the N Calculator. Figure 1. Agro-climatic zones in Manitoba. Climate in the Uplands area (SW) tends to have lower rainfall and greater evapotranspiration than the lowlands and gray wooded zones. Table 1. Agro-climatic environment (A-C Env) categories based on agro-climatic zones and soil characteristics. Figure 7. Screen shot of return $/ac to N for wheat in a dry agro-climatic environment with urea fertilizer cost as a variable (input data from Figure 5). It is apparent that the N rate to maximize return to N is influenced by crop price and N cost, but is often less than growers suspect. Users may also assess the economic risk of under/over fertilizing. This calculator is available on the Manitoba Agriculture, Food and Rural Initiatives website at: http://www.gov.mb.ca/agriculture/financial/farm/nitrogencalc.html . Figure 4. Hybrid and open pollinated (OP) canola response to N; 34 sites in the Moist agro-climatic environment. Turbulent crop prices and nitrogen costs prompted development of an economic return component when presenting these guidelines. An Excel spreadsheet format according to Rankin (2005) was modified to accommodate the different crop-environment combinations and inclusion of soil N test results (Figure 5-7). References Karamanos, R., J. Heard and T. Jensen. 2009. A public-private cooperative model for updating nitrogen fertilizer recommendations – the Manitoba experience. Better Crops Vol. 93. No. 3. Rankin, M.2005. Nitrogen $ Rate of Return Calculator Version 3. University of Wisconsin – Extension: http//www.uwex.edu/ces/crops/NComparison.htm