Download
1 / 50
500 likes | 685 Vues
C O L O R. A SET OF CODES GENERATED BY THE BRAİN How do you quantify? How do you use?. Tiger in forest? cat on a rug?. Color perception depends on. What is blue?. A blue object has a surface material that reflects wavelength corresponding blue, when illuminated by white light .

E N D
COLOR A SET OF CODES GENERATED BY THE BRAİN How do you quantify? How do you use?
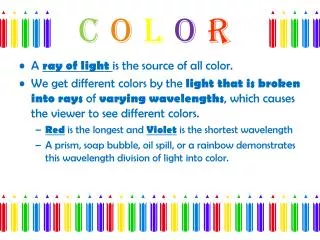
What is blue? • A blue object has a surface material that reflects wavelength corresponding blue, when illuminated by white light
Coding methods for humans • RGB is an additive system (add colors to black) used for displays. • CMY is a subtractive system for printing. • HSI is a good perceptual space for art, psychology, and recognition. • YIQ used for TV is good for compression.
Choromaticity: Normalize r+g+b=1 Plot g vs. b
Editing saturation of colors (Left) Image of food originating from a digital camera; (center) saturation value of each pixel decreased 20%; (right) saturation value of each pixel increased 40%.
YIQ and YUV for TV signals • Have better compression properties • Luminance Y encoded using more bits than chrominance values I and Q; humans more sensitive to Y than I,Q • Luminance used by black/white TVs • All 3 values used by color TVs • YUV encoding used in some digital video and JPEG and MPEG compression
Conversion from RGB to YIQ An approximate linear transformation from RGB to YIQ: We often use this for color to gray-tone conversion.
How do you use color? • Image retrieval • Segmentation • Recognition • Detection • Edge detection • Connected component analysis
Color histograms can represent an image • Histogram is fast and easy to compute. • Size can easily be normalized so that different image histograms can be compared. • Can match color histograms for database query or classification.
How to make a color histogram • Make 3 histograms and concatenate them • Use normalized color space and 2D histograms. • Create a single pseudo color between 0 and 255 by using 2bits of R, 2bits of G and 2 bits of B (which bits?)
Histograms of two color images: Take 2 most significant bit in R,G,B obtain 26=64 bins
Histogram Similarity • Normalized histogram approximates the pdf • Look at cross entropy • Look at the sum of suare error • Look at intersection and match
Retrieval from image database Top left image is query image. The others are retrieved by having similar color histogram
Recognition: Apples versus Oranges H S I Separate HSI histograms for apples (left) and oranges (right) used by IBM’s VeggieVision for recognizing produce at the grocery store checkout station
Face detection in video frame: Train first • (left) input video frame • (center) pixels classified according to RGB space • (right) largest connected component with aspect similar to a face (by Vera Bakic)
Skin color in RGB space (shown as normalized red vs normalized green) Purple region shows skin color samples from several people. Blue and yellow regions show skin in shadow or behind a beard.
Color Clustering by K-means Algorithm Form K-means clusters from a set of n-dimensional vectors 1. Set ic (iteration count) to 1 2. Choose randomly a set of K means m1(1), …, mK(1). 3. For each vector xi, compute D(xi,mk(ic)), k=1,…K and assign xi to the cluster Cj with nearest mean. 4. Increment ic by 1, update the means to get m1(ic),…,mK(ic). 5. Repeat steps 3 and 4 until Ck(ic) = Ck(ic+1) for all k.
K-means Clustering Example Original RGB Image Color Clusters by K-Means
Chapter 6 Color Image Processing