Download
1 / 22
220 likes | 317 Vues
Explore job efficiency metrics in grid computing, challenges faced, and proposed improvements to enhance overall performance. Discusses user jobs, efficiency profiles, efficiency gains, and strategies for optimizing job processing.

E N D
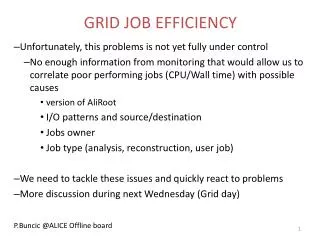
GRID JOB EFFICIENCY • Unfortunately, this problems is not yet fully under control • No enough information from monitoring that would allow us to correlate poor performing jobs (CPU/Wall time) with possible causes • version of AliRoot • I/O patterns and source/destination • Jobs owner • Job type (analysis, reconstruction, user job) • We need to tackle these issues and quickly react to problems • More discussion during next Wednesday (Grid day) P.Buncic @ALICE Offline board
Job efficiency Defined as CPU/Wall time of the process (batch) i.e. if your job runs for 1 hour elapsed time and uses 30 minutes of CPU, the efficiency is 50% One of the most-watched metrics in the Grid world Easy to calculate, understandable by all Just one of themetrics to judge what is the ‘usefulness’ of the processing We have to make sure the numbers are high >85% for T0/T1s, >80% for T2s Otherwise, we enter into the ‘table of shame’
Efficiency profiles The following studies were done with information already available in MonALISA Collected through the tools and job instrumentation provided by Costinand Andrei All jobs are equipped with traffic and efficiency factor, in the case of LEGO trains, this information is aggregated per train
Summary of operations 2012/13 60% simulation 10% organized analysis 10% RAW data reco, 20% individual user analysis 465 individual users
One week of site efficiency User jobs in the system Tue Wed Thu Fri Sat Sun Mon Clearly visible ‘weekday effects working hours’ pattern Average efficiency = 84%
One week aliprod efficiency • aliprod = MC + AOD filtering + QA • No brainer – the efficiency is high • Contributing to the overall efficiency at @60% • Nothing to gain here, 100% efficiency is not • possible by definition
One week alidaq efficiency • alidaq = RAW data processing + AOD filtering + QA • Not too bad, contributing to the overall efficiency @10%
One week alitrain efficiency • alitrain = LEGOtrains • Very respectable, low efficiency (mostly) when few jobs (tails of merging etc..) – small contribution to the overall efficiency • Contributes to the overall efficiency @10% level
One week individual user efficiencies The ‘carpet’, 180 users, average =26%, contribution to total @20% level
Efficiency gains The largest efficiency gain can be achieved through improvements in individual user jobs Despite high complexity, the LEGO train efficiency is already high Just moving ½ of the individual user jobs to LEGO would result in immediate ~7% increase in overall efficiency! Then there is moving from ESDs to AODs Always in the books, but uptake is still slow
Top 10…. Bottom 10…names removed to protect the innocent … looking at the user jobs
Top user job analysis • Starting from job table, IDs, completion rate…. (also quick access through ‘My jobs’ tab)
Top user job analysis (2) • At a job level
Top user job analysis (3) • And the summary • The efficiency is high – nothing obvious on site level • From the user – this is effectively an MC embedding task, using ESDs
Another top user summary • Analysis on AOD with very high CPU component (see running time) • Analysis train code with ‘modifications’?
Low efficiencyuser job analysis • The efficiency does not show a clear site/number of files dependency • The input rate is not high • MC ESD analysis, same tag as the ‘top user’ efficiency • Could this be a ‘kinematics access’ data issue? • This is not a ‘test job’ – most of this user jobs over the last week are similar: 649 master jobs, 4782 sub-jobs
Low efficiencyuser job analysis (2) • Job type same as previous slide, different period, different AN tag, different user…
Medium efficiencyuser job analysis • Data intensive job… • Clear efficiency dependency on the input rate • PbPb AOD analysis, 100GB input are ~200K events • To achieve > 95% efficiency, this type of job requires ~3MB/sec/core throughput • For an average 24-core node, this translates to 72MB/sec/node • Not reasonable to expect the centres to support such rates • This job clearly belongs in a train…
Summary Ttree cache enabling clearly improved the overall job efficiency The LEGO trains system is highly efficient in average, independent on the type of analysis Study not in this talk Users do a variety of things on the Grid – they are very proficient in using the resource The job efficiencies vary a lot, depending the tasks If we concentrate only on the low efficiency, the two main reasons appear to be Analysis of MC ESDs Tasks with very high I/O component
What can we do Continue pushing more users toward analysis trains Cannot do this without the help of PWGs Continue pushing for AOD-based analysis No effort is spared to have up-to-date AODs for all productions Send alerts to low-efficiency users (similar to the ill-fated ‘high memory users’) These will be mostly ignored Preventive measure – lower quotas until situation improves This will be very unpopular Push individual analysis elsewhere… ideas and capacities welcome Reduce the size of the containers This will coincidentally help with our acute disk situation