Modeling Job Time Properties in Grid Systems: Insights from the Grid Observatory
This study explores the complex behaviors and emergent properties of job time in grid computing systems, based on 20 months of data collection at the Grid Observatory. With over 28 million jobs analyzed, we identify modeling patterns using power-law distributions, log-normal characteristics, and various lifecycle analytics. The research highlights the interconnectivity of users and computing elements (CEs) while examining degree distributions and job length variances. Ultimately, we propose a framework for understanding grid behavior as a complex network informed by diverse scientific disciplines.

Modeling Job Time Properties in Grid Systems: Insights from the Grid Observatory
E N D
Presentation Transcript
Modeling Grid JobTime Properties Lovro Ilijašić Lorenza Saitta University of Eastern Piedmont, Italy
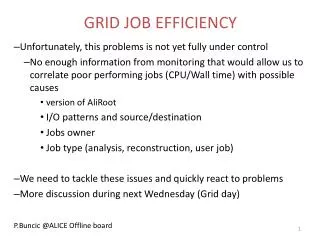
Grid Observatory • The Grid Observatory cluster of EGEE – the scientific view • Data collection, analysis of behaviour and usage • 20 months of data, more than 28 million jobs • Development of models • Grid is more than just a sum of its parts Modeling Grid JobTime Properties
Emergent Behaviour Properties that are apparent only on higher levels of organization and are not present on the lower ones Emergent Behaviour is observable on all levels of reality Modeling Grid Job Time Properties
Power Law Pareto distribution Zipf’s law 80-20 rule Self similarity Modeling Grid Job Time Properties
Degree Distributions In- and out-degree distributions: How users connect (use) CEs Weighted degrees: Distribution of number of jobs Modeling Grid Job Time Properties
Job Lifecycle Analysis Modeling Grid Job Time Properties
Distributions of Job Lengths Modeling Grid Job Time Properties
Distributions in log-log scale Modeling Grid Job Time Properties
Power-law vs. Log-normal Power-law: preferential attachment Power-law: optimization of the average amount of information per unit transmission cost Power-law: monkeys typing randomly Probabilities of letters not equal: power-law or log-normal? Modeling Grid Job Time Properties
Log-normal vs. Power-law Log-normal: multiplicative processes At each step, the event (Xt) may grow or shrink, according to a random variable Ft: Xt = Ft Xt-1 Multiplicative models can also generate Pareto distribution if there is not a minimum size of event. Otherwise it is log-normal Intermixing of generations, where t is random variable, leads to power law. Modeling Grid Job Time Properties
Log-normal Fitted Distributions Modeling Grid Job Time Properties
Alternatives Double Pareto distribution Double Pareto log-normal distribution More distribution parameters that allow better fitting Modeling Grid Job Time Properties
Modeling Grid JobTime Properties Lovro Ilijašić Lorenza Saitta University of Eastern Piedmont, Italy
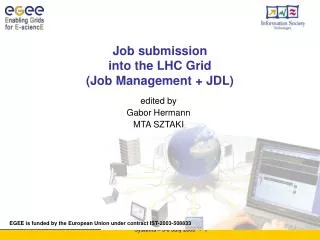
Complex Networks Complex Networks – Complex systems represented as graphs Gathered experiences from Physics, Chemistry, Biology, Computer Science, Sociology, Economics… Representing Grid as a Complex Network 20 months of log data, more than 28 million jobs Edges representing jobs go from Users to CEs Modeling Grid Job Time Properties
Number of jobs for each user Modeling Grid Job Time Properties