CO2 Fertilization and Methane Emissions: Impacts on Plants and Climate Change
This article explores the effects of elevated carbon dioxide levels on plants, highlighting increased water use efficiency due to smaller stomata and enhanced photosynthesis rates. It also delves into methane (CH4) emissions, discussing various sources and sinks, including agriculture, natural sources, and human activities. With a global warming potential 23 times that of CO2, CH4's contribution to climate change is significant. Understanding the dynamics of these gases is crucial in addressing global warming and developing effective environmental policies.

CO2 Fertilization and Methane Emissions: Impacts on Plants and Climate Change
E N D
Presentation Transcript
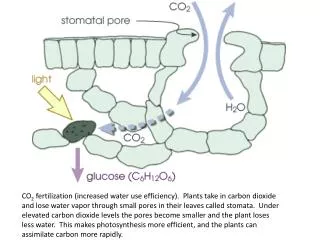
CO2 fertilization (increased water use efficiency). Plants take in carbon dioxide and lose water vapor through small pores in their leaves called stomata. Under elevated carbon dioxide levels the pores become smaller and the plant loses less water. This makes photosynthesis more efficient, and the plants can assimilate carbon more rapidly.
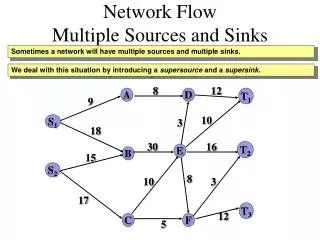
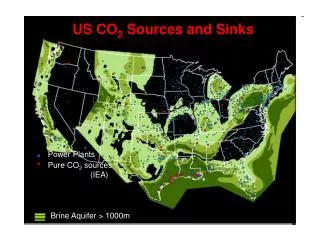
Methane sources and sinks (Mt CH4 yr-1) (Lowe 2006)
Sources [Tg/yr] Sinks [Tg/yr] Total~ 600 Tg(CH4/y) Biomass burning Transport to stratosphere Oxidation in soils Natural sources Rice paddies wetlands termites Ocean hydrates Ruminants Energy Domestic waste Tropospheric OH Atmospheric life time ~ 9 years Known sources and sinks of atmospheric CH4 1990 – 2000
Methane sources and sinks (Mt CH4 yr-1) (Lowe 2006)
Greenhouse gas global warming potentials(100 year time horizon)
Methane sources and sinks (Mt CH4 yr-1) (Lowe 2006)
Methane (CH4) production: • CH4 has 23 times the greenhouse potential of CO2 Anthropogenic carbon dioxide emissions about 7GtC/yr
Methane emissions (Tg CH4) per source category as used in the TM3 model for the period August through November 2003 and for the whole year (between brackets). Frankenberg et al. 2005
Difference between measured and simulated methane emissions (Frankenberg et al. 2005)
Summary living plants • 9 plant species (C3 and C4) • 18 l volume incubation chambers • dependence on sunlight • typical emission rates: 12 to 370 ng g(dw)-1 h-1 • grown on soil and hydroponically
Methane (CH4) production: • CH4 has 23 times the greenhouse potential of CO2
Sources of atmospheric carbon • Respiration (autotrophic and heterotrophic) • Burning of fossil fuels • over past 2 centuries, source of 480-500 Gt (Pg) C (IPCC 2001) • comparable in size to terrestrial plant pool • current rate: 5.3 GtCyr-1 (IPCC 2001) • Natural fires • Outgassing of CO2: • from fresh water: 0.9 GtCyr-1 (Richey et al 2002) • from ocean • from soils • Methane (CH4) production: • CH4 has 23 times the greenhouse potential of CO2
CH4 trend NOAA 12.3% reduction in tropical forests between 1990 and 2000 6-20 Tg CH4 yr-1 Source-sink imbalance 14 Tg yr-1 (IPCC) Source: NOAA/CMDL [http://www.cmdl.noaa.gov]