Download
1 / 19
190 likes | 293 Vues
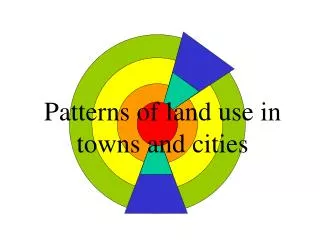
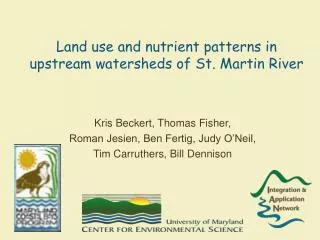
Land use and nutrient patterns in upstream watersheds of St. Martin River. Kris Beckert, Thomas Fisher, Roman Jesien, Ben Fertig, Judy O’Neil, Tim Carruthers, Bill Dennison. Methods. Monthly nutrient data obtained for 6 streams in St. Martin River watershed July 2006-Jan 2008

E N D
Land use and nutrient patterns in upstream watersheds of St. Martin River Kris Beckert, Thomas Fisher, Roman Jesien, Ben Fertig, Judy O’Neil, Tim Carruthers, Bill Dennison
Methods • Monthly nutrient data obtained for 6 streams in St. Martin River watershed July 2006-Jan 2008 • Aerial photography used to re-draw land use polygons in GIS • Land use calculation for stream sub-watersheds in St. Martin River region • USGS average monthly discharge data for Birch Branch at Showell July 2006- Sept 2007 • Total Nitrogen and Total Phosphorus yearly loading • Regression analysis of land use vs. Dec-March nutrient concentrations
Correction of Land Use Polygons • 2002 land use files obtained from Maryland Department of Planning • Overestimation of land use, especially feeding operations • Polygons re-drawn closer to aerial imagery Initial Feeding Operations Polygon
Correction of Land Use Polygons • 2002 land use files obtained from Maryland Department of Planning • Overestimation of land use, especially feeding operations • Polygons re-drawn closer to aerial imagery New Feeding Operations Polygon Forest
Stream Sites B5 B6 B3 B1 B2 USGS gage B8
B6: Unnamed Tributary *Lowest observed value ***Highest observed value
B8: Church Branch *Lowest observed value ***Highest observed value