Do Now 12/2/09
Do Now 12/2/09. Take out HW from last night. - Punchline worksheet 7.19 Copy HW in planner. Text p. 328, #3-6, 8-12 evens, 16 & 17 (4 graphs) Quiz sections 5.5 - 5.7 Friday. 1) y – 2 = 4/3(x – 7) 2) y + 4 = -2/5(x – 4) 3) y = 3x + 8 4) y = 1/4x + 3/2 5) 2x + 3y = -11


Do Now 12/2/09
E N D
Presentation Transcript
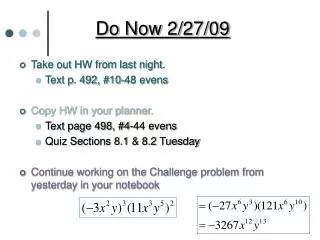
Do Now 12/2/09 Take out HW from last night. - Punchline worksheet 7.19 Copy HW in planner. • Text p. 328, #3-6, 8-12 evens, 16 & 17 (4 graphs) • Quiz sections 5.5 - 5.7 Friday
1) y – 2 = 4/3(x – 7) 2) y + 4 = -2/5(x – 4) 3) y = 3x + 8 4) y = 1/4x + 3/2 5) 2x + 3y = -11 6) -5x + y = 7 7) y – 7 = 2(x + 4) 8) y + 1= -3/8(x – 6) 9) y = 5/2x – 1 10) y = -1/6x + 3/2 11) -3x + 4y = 15 12) 7x + 2y = -15 13) y = 5/3x – 3 14) y = -4/9x – 40/9 15) y = -3x – 6 Homework Punchline worksheet 7.19 “Did You Hear About the Mathematician Who Wanted to Make a Fruit Salad, So He Bought Some Apples and Oranges?” “AND ORDERED PEARS”
Objective • SWBAT make scatter plots and write equations to model data
Section 5.6 “Fit a Line to Data” a graph used to determine whether there is a relationship between paired data. Scatter Plot y x
Scatter plots can show trends (patterns) in the data. y y y x x x Relatively no correlation Positive correlation Negative correlation x and y have no apparent relationship. As y tends to increase, x tends to increase. As y tends to decrease, x tends to increase.
Make a scatter plot of the data in the table. Describe the correlation of the data. y-axis The scatter plot shows a positive correlation because as x tends to increase, y tends to increase. 4 3 2 1 x-axis 0 1 2 3 4 5 6 7
Make a scatter plot of the data in the table. Describe the correlation of the data. y-axis The scatter plot shows a negative correlation because as minutes on the treadmill increase, ounces of water in the water bottle decreases. 12 8 Ounces of water in water bottle 4 x-axis 0 5 10 15 20 25 30 35 Minutes on the treadmill
Modeling Data When data show a positive or negative correlation, you can model the trend in the data using a LINE OF FIT Make a scatter plot of the data. Decide whether the data can be a modeled by a line. (Does it have positive or negative correlation?) Draw a line that appears to fit the data closely. Write an equation using two points on the line. (The points do not have to be actual data pairs, but they do have to be on the line.)
Draw a line of fit for the scatter plot. Write an equation that models the number of ounces of water left in the water bottle as a function of minutes on the treadmill. Write an equation using two points on the line. y-axis 12 Use the points (5,12) and (30,4). 12 – 4 = _8_ 5 – 30 -25 8 Ounces of water in water bottle Find the y-intercept. Use (5,12). 4 y = mx + b 12 = 8 (5) + b b = 68 -25 5 0 5 10 15 20 25 30 35 x-axis y = 8 x + 68 -25 5 Minutes on the treadmill
Draw a line of fit for the scatter plot. Write an equation that models the number of years since 2000 as a function student enrollment. Years since 2000 Enrollment Enrollment at Howell Middle School South Write an equation using two points on the line. 950 940 Use the points (4, 900) and (6, 910). 930 910 – 900 = _10_ = 5 6 – 4 2 920 Student enrollment 910 Find the y-intercept. Use (4, 900). 900 y = mx + b 900 = 5(4) + b b = 880 890 880 x-axis y = 5x + 880 00 01 02 03 04 05 06 07 08 09 year
Homework 24 Text p. 328, #3-6, 8-12 evens, 16 & 17 (4 graphs)