Healthy People 2010
410 likes | 610 Vues
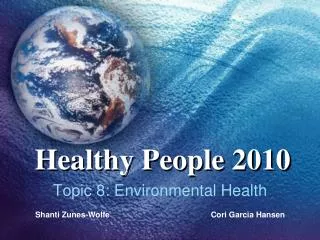
Healthy People 2010. Topic 8: Environmental Health. Shanti Zunes -Wolfe Cori Garcia Hansen. The Goal of Environmental Health. Promote health for all through a healthy environment. 1. http://www.healthypeople.gov/Document/HTML/Volume1/08Environmental.htm#_Toc490564699.

Healthy People 2010
E N D
Presentation Transcript
Healthy People 2010 Topic 8: Environmental Health ShantiZunes-Wolfe Cori Garcia Hansen
The Goal of Environmental Health Promote health for all through a healthy environment.1 http://www.healthypeople.gov/Document/HTML/Volume1/08Environmental.htm#_Toc490564699
Approximately 25% of preventable illnesses worldwide can be attributed to poor environmental quality. In the United States, air pollution alone is estimated to be associated with 50,000 premature deaths and an estimated $40 to $50 billion in health-related costs annually.2
According to the World Health Organization3 “In its broadest sense, environmental health comprises those aspects of • human health, • disease, • and injury that are determined or influenced by factors in the environment.” World Health Organization (WHO). Indicators for Policy and Decision Making in EnvironmentalHealth. (Draft). Geneva, Switzerland: WHO, 1997.
Health of the broad physical and social environment includes:3 Urban Development Housing Environmental Health Industry Agriculture Land-use Transportation World Health Organization (WHO). Indicators for Policy and Decision Making in EnvironmentalHealth. (Draft). Geneva, Switzerland: WHO, 1997.
Core Environmental Public Health Indicators4 • Hazard Indicators (potential for exposure to contaminants or hazardous conditions) • Health Effect Indicators (occurrence of morbidity or mortality attributed to exposure) • Intervention Indicators (programs or official policies addressing environmental hazards) CDC Biomonitoring Overview http://www.cdc.gov/nceh/indicators/summary.htm
Environmental Health Topics1 1. Outdoor Air Quality 2. Water Quality 3. Toxics and Waste 4. Healthy Homes and Healthy Communities 5. Infrastructure and Surveillance 6. Global Environmental Health
Some New Programs Developed From HP2010 Topic 8 • Environmental Public Health Tracking Program (EPHT) • EPA's Clean Air Interstate Rule and clean Air Mercury Rule • National Biomonitoring Program (BMP) • The Genes and Environment Initiative (GEI) • (A component is the NIEHS-led • Exposure Biology Program)
Toxics and Waste1 • 8-11 • Elevated blood lead levels in children • 8-12 • Risks posed by hazardous sites
Blood Lead Levels1 • Goal: Completely eliminate all elevated blood lead levels in children ages 1 to 6. • Elevated blood lead levels in children is anything above 10µg/dl. • Goal has not been met, but has significantly improved.
Elevated Blood Lead Levels • Highest risk on developing brain, but adults can be affected as well.6 • Disparities still a problem: risk is higher for those with low income, living in older housing, and belonging to certain racial and ethnic groups. • From 1980s to 1990s: 2-3 million children with elevated BLLs down to 900,000 by 1994. • “Spread the word” campaigns, including screening measures and effective community action.1
National Organizations • Childhood Lead Poisoning Prevention Program (CDC)7 • National Lead Poisoning Prevention Week • Childhood Blood Lead Registry • Let’s Make Lead History8 • Upstate New York
Washington and Whatcom • BLLs in children is very low compared to other states, but people remain at risk for contamination. • Whatcom has some of worst risk factors.9 • Washington State Department of Health10 • Northwest Pediatric Environmental Health Specialty Unit (UW)11 • Elevated lead levels in water fountain at Western12
Hazardous Sites1 • 8-12a. National Priority List sites • Brownfield properties formally designated under EPA’s Superfund program. • Pose a significant threat to health of people and/or the environment. • 8-12d. Brownfield Properties • managed through state and local programs.
Statistics1 • 1,200 National Priority List sites • 1,500 Brownfield properties • Goal: Clean up 98% • All Superfund sites from 1998 baseline have been cleaned up. Goal met. • More brownfield have been added to the NPL since then.
Brownfields • 1997 Tax Payer Relief Act: incentive for cleanup & redevelopment of brownfields.13 • Environmental Protection Agency14 • Brownfields Redevelopment Toolbox for Disadvantaged Communities • Washington Department of Ecology15 • Model Toxics Control Act • Brownfields Coalition16 • Bellingham: Holly Street Landfill17and Waterway Cleanup.9
Whatcom Counts9 Now in “red zone” for hazardous waste zones.
Oeser Co. • Bellingham claims a Superfund site.9 • Near Bellingham Technical College. • Oeser was a wood treatment plant for forty years until closed in 1970’s. • Discovered in 1979, not inspected until 1988. • Put on National Priorities List in 1997 and removal began in 1998. • Remedial action still taking place.18
Outdoor Air Quality1 HP 2010: Objective 8-1 Reduce the proportion of persons exposed to air that does not meet the U.S. EPA’s health based standards for harmful air pollutants.
Air Pollution19 EPA Criteria Pollutants/ “Smog” Lead Particulate Carbon Monoxide Nitrogen Dioxide Ground-level Ozone Sulfur Dioxide See handout for more information
Highlighted National Programs Environmental Protection Agency Office of Air and Radiation20 NASA’s Aura, Global Climate Change Missions: NASA’s Eyes on the Earth21,22
Programs Working to Improve Air Quality EPA's Office of Air and Radiation 20, 26 The Office of Air Quality Planning and Standards 23 AirData24 AirNow25
Current Outdoor Air Quality Status26 • Nationwide Air Pollution has decreased from 1990-2007 percent improvement:
Current Outdoor Air Quality Status26 The EPA reports: Despite clean air progress, in 2007, 158.5 million people lived in counties that exceeded any national ambient air quality standard (NAAQS) Ground level ozone and particle pollution still present challenges in many area of the country.
NASA’s Aura: New Eye for Clean Air Provides global data collection of air pollution on a daily basis. Four instruments are used by the Satellite: Tropospheric Emission Spectrometer (TES) Microwave Limb Sounder (MLS) Ozone Monitoring Instrument (OMI) High Resolution Dynamics Limb Sounder (HIRDLS) To Learn More27 Eyes on the Earth28 Video29
Highlighted Washington Programs30 Environmental Public Health Tracking Program (US/WA) Department of Ecology Air Monitoring WA Air Monitoring
Whatcom County & Region EPA – Puget Sound Georgia Basin Ecosystem, Region 1031 Northwest Clean Air Agency (NWCAA)32 Puget Sound Clean Air Agency33
Outdoor Air Quality1 • HP 2010: Objective 8-2 • Increase use of alternative modes of transportation to reduce motor vehicle emissions and improve the Nation’s air quality
National Transportation and Air Quality34 • EPA's Office of Transportation and Air Quality (OTAQ) protects public health and the environment by: • regulating air pollution from motor vehicles, engines, and the fuels used to operate them, • and by encouraging travel choices that minimize emissions.
USDOT: Transportation Control Measures provide35: • improved public transit, • traffic flow improvements and high-occupancy vehicle lanes, • shared-ride services, • bicycle/pedestrian facilities, • and flexible work schedules.
2004 Update of the National Bicycling and Walking Study To Learn More Visit the Website: http://www.fhwa.dot.gov/environment/bikeped/
Washington State Department of Transportation – Reinvent Your Commute37 -- Bicycle in Washington38
WashingtonCommute Trip Reduction Program37 2006: The Washington State Legislature passed the Commute Trip Reduction Efficiency Act Requires that counties with the greatest automobile-related air pollution and traffic congestion…… Must develop and implement plans to reduce single-occupant vehicle trips.
Commute Trip Reduction Program37 • Statewide, 26,000 less vehicles on the state's roads each weekday morning in 2007 • 7.9 million gallons less gas used, • saving commuters about $23 million • reduced criteria pollutants by nearly 4,000 tons • and the emissions of carbon dioxide-equivalent gases by nearly 85,600 tons.
http://www.re-sources.org/ Whatcom County39-46 Whatcom County Trails, Greenways, and Greenbelts.
Whatcom Smart Trips began July 1, 2006. As of 3/2/2009:9,176 Smart Trip makers have recorded40: 170,531 walking trips 333,798 bus trips 261,993 bicycling trips 241,541 ridesharing trips https://www.whatcomsmarttrips.org/news/default.aspx
That's 15,975,368 miles not driven AND... 40 6,492.19 tons of carbon dioxide pollution avoided 23.93 tons of hydrocarbons pollution avoided 218.17 tons of carbon monoxide pollution avoided 16.71 tons of nitrogen oxides avoided .09 tons of particulate matter (PM10) avoided 666,173 gallons of gasoline saved
Outdoor Air Quality Disparities1 Source and date
Health Disparities47 • Healthy People 2010 top priority is the elimination of health disparities. • Minority and economically disadvantaged populations. • Residential segregation • Minorities overrepresented in communities with constrained economic opportunities. • Health differences • cancer, infant and adult mortality, homicide, life expectancy, tuberculosis.
Health Disparities47 • Ambient air pollution • Particulate matter • Blood mercury levels • Scientists, health care workers, community activists need to find better ways to measure data, address risk, incorporate the connections between exposure and disease. • Alternative approaches for racial, ethnic, economic, and social groupings.