Download
1 / 20
200 likes | 397 Vues
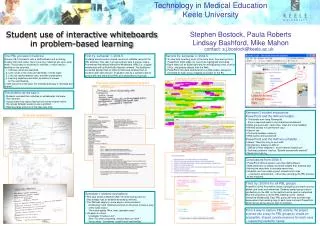
Effects of Interactive Whiteboards on Student Achievement. Karen Swan, University of Illinois Springfield Mark van ‘t Hooft, Jason Schenker & Annette Kratcoski Kent State University. Interactive whiteboards allow . . . presentation interaction writing/highlighting recording.

E N D
Effects of Interactive Whiteboards on Student Achievement Karen Swan, University of Illinois Springfield Mark van ‘t Hooft, Jason Schenker & Annette Kratcoski Kent State University
Interactive whiteboards allow . . . • presentation • interaction • writing/highlighting • recording . . . hence emphasize active engagement (Bransford, Brown & Cocking, 1999)
is liked by teachers & students(Beeland, 2002; Hall & Higgins, 2005; Kennewell & Morgan, 2003; Smith, Higgins, Wall & Miller, 2005) leads to greater student motivation & engagement(Beeland, 2002; Miller, Glover & Averis, 2004, 2005; LeDuff, 2004; Painter, Whiting & Wolters, 2005; Smith, Hardman & Higgins, 2006) shifts instruction from presentation to interaction(Cuthell, 2005; Painter, Whiting & Wolters, 2005) shifts focus away from teachers & onto content(Miller, Glover & Averis, 2003, 2004) enhances student achievement(Zittle, 2004; Dhindsa & Emran, 2006) Research has found that the use of interactive whiteboards:
Research Questions: • Do students whose teachers use interactive whiteboards to assist in math or reading/language arts instruction perform better academically than those who do not? • Among classes where interactive whiteboards are used, are there differences in usage between classes whose average test scores are above grade level means and those whose students are at or below the mean?
Subjects & Setting: • all students in grades 3-8 in a small city school district in northern Ohio (n=3,192) • 1/3 minority (21% African-American) • 8% below poverty line • district on Academic Watch • 11 elementary schools, 3 junior high schools, 1 alternative school
Subjects & Setting: • study compared performance of students whose teachers used whiteboards (n=142) with students whose teachers didn’t use them • overall, teachers who had whiteboards used them frequently – 3 times /week or more • whiteboards were used more frequently in the elementary grades for content area teaching and learning than in junior high • but used consistently across grade levels for classroom management
Data Sources & Analysis: • 2007 Ohio Achievement Test (OAT) scores in reading & mathematics for all students in grades 3-8 • compared between classes using whiteboards & those not using them via ANOVA • also by teachers, schools & grade levels & demographics
Data Sources & Analysis: • self-report data on use of whiteboards collected through online survey, every week for 10 weeks in spring of 2007 • quantitative data on frequency of use for mathematics, reading, &/or classroom management, averaged across reporting period • qualitative data on effective or interesting uses made of whiteboards during the week, categorized thematically • compared descriptively between teachers whose students scored above the overall mean on OATs (13 reading, 11 math, 6 both / 142) & those whose students score at or below the mean
Reading/Language Arts Achievement: * * * overall means: no whiteboard = 415.55 n = 1466 whiteboard = 416.95 n = 1686
Mathematics Achievement: * * * overall means: no whiteboard = 414.63 n = 1379 whiteboard = 415.81 n = 1813
Comparisons of High Performing to Average & Below Average Performing Classes: Frequency of Whiteboard Use n=19 n=16 n=17 n=14
Whiteboard Use in Mathematics functions:purposes: • simple display • interactive charts, graphs, manipulatives • Internet information & activities • motivation • present content • OAT prep / drill & practice • games • assessment
Comparisons of High Performing to Average & Below Average Performing Classes: visualization vs. motivation “Students worked with pattern blocks on the board to build fractions using different values.” “I used it to teach solving and graphing an inequality on a coordinate graph.” “The SmartBoard serves as an incredible incentive for positive behavior. My students are well aware that coming to the SmartBoard is a privilege and only students who are quiet and follow instructions are allowed to engage in this activity.”
Comparisons of High Performing to Average & Below Average Performing Classes: student-centered vs. teacher-centered “This type of medium holds interest more than any other I've used in 28 years of teaching. Children take to it so quickly and come up with so many ideas and alternatives in lessons that I have prepared that we change on the spot.” “We are in the fractions unit. I designed a Power Point presentation called ‘Fraction Action’ to encourage students to get more excited about fractions.” “I used the ruler to demonstrate how to line up for measuring and explained l/2 inch.”
Whiteboard Use in Reading/Language Arts functions:purposes: • simple display • graphic organizers • Internet information & activities • video conferencing • motivation • present content • OAT prep • games • student presentations • Support special needs students
Comparisons of High Performing to Average & Below Average Performing Classes: student-centered vs. teacher-centered “Students gave PowerPoint presentations they created for a book share, using Inspiration webs and propaganda techniques to persuade others to read the books.” “I used it to practice singular and plural possessives. I wrote sentences and children put apostrophe where it belonged. I could move the apostrophe from before the ’s’ and after the ‘s’ to demo the difference.”
Comparisons of High Performing to Average & Below Average Performing Classes: visualization vs. presentation “During the week we correct grammar sentences, we rearrange words too as part of peer editing; we take notes, watch movies, share student PowerPoints and graphic organizers.” “Timer to keep students on track; daily list of what will be covered in class; sharing vocabulary words on the board.” We complete workbook pages at the SmartBoard rather than individually at seats.”
Conclusions: • Interactive whiteboards have the potential to enhance student performance in mathematics and reading/language arts … • . . . especially when such uses are student-centered and take full advantage of their unique capabilities, such as support for interactivity and visualization. • Further investigation of their use is clearly indicated.
www.rcet.org kswan4@uis.edu