Chapter 4 Exercise Metabolism
Chapter 4 Exercise Metabolism. EXERCISE PHYSIOLOGY Theory and Application to Fitness and Performance, 6 th edition Scott K. Powers & Edward T. Howley. Objectives. Discuss the relationship between exercise intensity/duration and the bioenergetic pathways Define the term oxygen deficit

Chapter 4 Exercise Metabolism
E N D
Presentation Transcript
Chapter 4Exercise Metabolism EXERCISE PHYSIOLOGY Theory and Application to Fitness and Performance, 6th edition Scott K. Powers & Edward T. Howley
Objectives • Discuss the relationship between exercise intensity/duration and the bioenergetic pathways • Define the term oxygen deficit • Define the term lactate threshold • Discuss several possible mechanisms for the sudden rise in blood-lactate during incremental exercise • List the factors that regulate fuel selection during different types of exercise
Objectives • Explain why fat metabolism is dependent on carbohydrate metabolism • Define the term oxygen debt • Give the physiological explanation for the observation that the O2 dept is greater following intense exercise when compared to the O2 debt following light exercise
Rest-to-Exercise Transitions • Oxygen uptake increases rapidly • Reaches steady state within 1-4 minutes • Oxygen deficit • Lag in oxygen uptake at the beginning of exercise • Suggests anaerobic pathways contribute to total ATP production • After steady state is reached, ATP requirement is met through aerobic ATP production
The Oxygen Deficit Fig 4.1
Differences in VO2 Between Trained & Untrained Subjects Fig 4.2
Recovery From Exercise Metabolic Responses • Oxygen debt or • Excess post-exercise oxygen consumption (EPOC) • Elevated VO2 for several minutes immediately following exercise • “Fast” portion of O2 debt • Resynthesis of stored PC • Replacing muscle and blood O2 stores • “Slow” portion of O2 debt • Elevated heart rate and breathing, energy need • Elevated body temperature, metabolic rate • Elevated epinephrine & norepinephrine, metabolic rate • Conversion of lactic acid to glucose (gluconeogenesis)
Oxygen Deficit and Debt During Light-Moderate and Heavy Exercise Fig 4.3
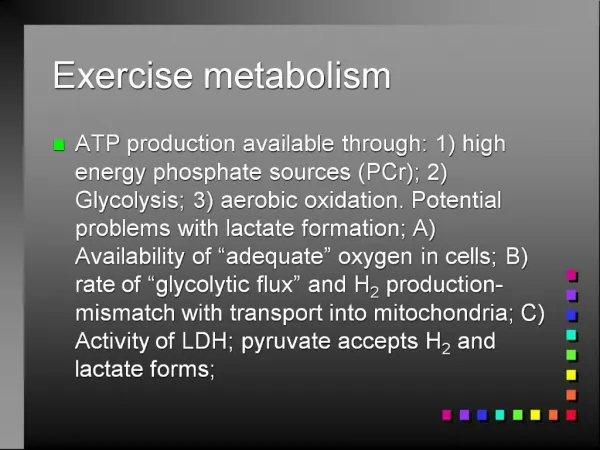
Metabolic Response to Exercise Short-Term Intense Exercise • High-intensity, short-term exercise (2-20 seconds) • ATP production through ATP-PC system • Intense exercise longer than 20 seconds • ATP production via anaerobic glycolysis • High-intensity exercise longer than 45 seconds • ATP production through ATP-PC, glycolysis, and aerobic systems
Metabolic Response to Exercise Prolonged Exercise • Exercise longer than 10 minutes • ATP production primarily from aerobic metabolism • Steady state oxygen uptake can generally be maintained • Prolonged exercise in a hot/humid environment or at high intensity • Steady state not achieved • Upward drift in oxygen uptake over time
Upward Drift in Oxygen Uptake During Prolonged Exercise Fig 4.6
Metabolic Response to Exercise Incremental Exercise VO2 – Ability to Deliver and Use Oxygen • Oxygen uptake increases linearly until VO2max is reached • No further increase in VO2 with increasing work rate • Physiological factors influencing VO2max • Ability of cardiorespiratory system to deliver oxygen to muscles • Ability of muscles to use oxygen and produce ATP aerobically
Lactate Threshold • The point at which blood lactic acid suddenly rises during incremental exercise • Also called the anaerobic threshold • Mechanisms for lactate threshold • Low muscle oxygen • Accelerated glycolysis • Recruitment of fast-twitch muscle fibers • Reduced rate of lactate removal from the blood • Practical uses in prediction of performance and as a marker of exercise intensity
Other Mechanisms for the Lactate Threshold • Failure of the mitochondrial hydrogen shuttle to keep pace with glycolysis • Excess NADH in sarcoplasm favors conversion of pyruvic acid to lactic acid • Type of LDH • Enzyme that converts pyruvic acid to lactic acid • LDH in fast-twitch fibers favors formation of lactic acid
Effect of Hydrogen Shuttle and LDH on Lactate Threshold Fig 4.9
Estimation of Fuel Utilization During Exercise • Respiratory exchange ratio (RER or R) • VCO2 / VO2 Fat (palmitic acid) = C16H32O2 C16H32O2 + 23O2 16CO2 + 16H2O + ?ATP R = VCO2/VO2 = 16 CO2 /23O2 = 0.70 Glucose = C6H12O6 C6H12O6+ 6O2 6CO2 + 6H2O + ?ATP R = VCO2/VO2 = 6 CO2 /6O2 = 1.00
Estimation of Fuel Utilization During Exercise • Indicates fuel utilization • 0.70 = 100% fat • 0.85 = 50% fat, 50% CHO • 1.00 = 100% CHO • During steady-state exercise • VCO2 and VO2 reflective of O2 consumption and CO2 production at the cellular level
Exercise Intensity and Fuel Selection • Low-intensity exercise (<30% VO2max) • Fats are primary fuel • High-intensity exercise (>70% VO2max) • CHO are primary fuel • “Crossover” concept • Describes the shift from fat to CHO metabolism as exercise intensity increases • Due to: • Recruitment of fast muscle fibers • Increasing blood levels of epinephrine
Exercise Duration and Fuel Selection • During prolonged exercise, there is a shift from CHO metabolism toward fat metabolism • Increased rate of lipolysis • Breakdown of triglycerides into glycerol and free fatty acids (FFA) • Stimulated by rising blood levels of epinephrine
Shift From CHO to Fat Metabolism During Prolonged Exercise Fig 4.13
Interaction of Fat and CHO Metabolism During Exercise • “Fats burn in a carbohydrate flame” • Glycogen is depleted during prolonged high-intensity exercise • Reduced rate of glycolysis and production of pyruvate • Reduced Krebs cycle intermediates • Reduced fat oxidation • Fats are metabolized by Krebs cycle
Sources of Fuel During Exercise • Carbohydrate • Blood glucose • Muscle glycogen • Fat • Plasma FFA (from adipose tissue lipolysis) • Intramuscular triglycerides • Protein • Only a small contribution to total energy production (only ~2%) • May increase to 5-15% late in prolonged exercise • Blood lactate • Gluconeogenesis via the Cori cycle