To Begin:
To Begin:. Log on and visit my blog Go to April 17 th and download the PowerPoint slides there Read through the slides here and answer questions in your notes. Scatter Plots and Statistics. Warm-Up. In English you talked about different techniques people can use to persuade others.

To Begin:
E N D
Presentation Transcript
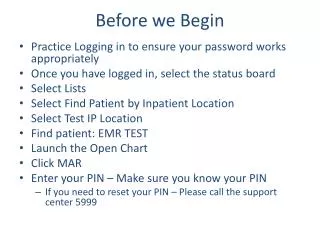
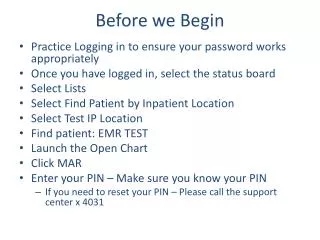
To Begin: • Log on and visit my blog • Go to April 17th and download the PowerPoint slides there • Read through the slides here and answer questions in your notes *DO NOT click "next" until you have completed all notes and activities for this page!*
Scatter Plots and Statistics *DO NOT click "next" until you have completed all notes and activities for this page!*
Warm-Up • In English you talked about different techniques people can use to persuade others. • Name some now: *DO NOT click "next" until you have completed all notes and activities for this page!*
Warm-Up • In English you talked about different techniques people can use to persuade others. • Name some now: Exaggeration Testimonial Bandwagon Technique Snob Appeal Emotional Appeal *DO NOT click "next" until you have completed all notes and activities for this page!*
Purpose of the Unit: Think about the Warm-Up • Purpose of the warm-up:Many of the persuasive choices you make in English can be made in presenting math as well • Purpose of the unit: This unit will help you to think logically about the information you are presented with, determine if it is a fair picture of the data, and create your own statistics from questions you create. *DO NOT click "next" until you have completed all notes and activities for this page!*
Where are we going in this unit? • Day 1: Overview (today) • Day 2: Misleading Data • Day 3: Reading Scatter Plots • Day 4: Creating Scatter Plots • Day 5: Solve for the Equation of a Trend Line • Day 6: Solve for the Equation of a Trend Line and Judge Fit • Day 7: Predict Future Values from Scatter Plots • Review • Test: May 2nd *DO NOT click "next" until you have completed all notes and activities for this page!*
Overview Day: Master the Basics • SWBAT form excellent quantitative questions • SWBAT choose appropriate scales for graphs • SWBAT identify independent and dependent variables *DO NOT click "next" until you have completed all notes and activities for this page!*
Vocab Reminder • Qualitative: Data that deals with qualities Example: Color of your hair • Quantative:Data that deals with numbers Example: Size shoes you wear • Correlation: Data that “goes together”. One affects the other, or they move together. *DO NOT click "next" until you have completed all notes and activities for this page!*
For this unit, we need 2 sets of data that are correlated • Let’s think of questions that “go together”, or questions where the data will be related, like • What is your shoe size and your height? • How much did you study and what was your recent test score? • How much TV do you watch and what is your average homework percentage? • List 2 more in your notes *DO NOT click "next" until you have completed all notes and activities for this page!*
Quantitative Questions • For this unit we are going to focus on quantitative question sets only because they are easier to graph since they use numbers. • Brainstorm 3 quantitative questions (must be different from before) *DO NOT click "next" until you have completed all notes and activities for this page!*
Independent vs. Dependent • Independent: Data that is not affected by anything else. It is the variable being changed. X-values. • Dependent: Data that is being measured. It DEPENDS on the independent data. Y-values. Example: Grade on exit ticket and test score independent dependent *DO NOT click "next" until you have completed all notes and activities for this page!*
Independent vs. Dependent • Go back to your list of qualitative questions and label one as the “independent” and the other as the “dependent” variable. *DO NOT click "next" until you have completed all notes and activities for this page!*
Selecting A Scale • Before you can avoid things like exaggeration in English class, commercials or ads, you need to know a little bit about your subject. • Same with math. Before you can avoid being tricked by misleading data, you need to understand how to represent data appropriately *DO NOT click "next" until you have completed all notes and activities for this page!*
Selecting A Scale Directions: Look at the table below. What is the independent variable? The dependent variable? What is the lowest value of the independent variable? What is the highest value of the independent variable? What is the lowest value of the dependent variable? What is the highest value of the dependent variable? *DO NOT click "next" until you have completed all notes and activities for this page!*
Selecting A Scale • When you select your scale, you are going to use these same steps. • Identify the lowest value of your independent variable. This is the low value of your x-axis • Identify the highest value of your independent variable. This is the highest value of your x-axis • Identify the lowest value of your dependent variable. This is the low value of your y-axis. • Identify the highest value of your dependent variable. This is the highest value of your y-axis. THEN 5. Choose an amount to move by so your graph doesn’t take too much or too little space. *DO NOT click "next" until you have completed all notes and activities for this page!*
Selecting a Scale Independent: Height—lowest: 50, highest: 67 Dependent: Weight—lowest: 100, highest: 190 Weight: Moving by 50’s made sense for the y-axis Height: Moving by 20’s made sense for the y-axis *DO NOT click "next" until you have completed all notes and activities for this page!*
Selecting a Scale • Select the appropriate scale for the graph below by following the steps listed on the previous page. Graph the data on your graph. *DO NOT click "next" until you have completed all notes and activities for this page!*
Think you got it? Make sure you can: • SWBAT form excellent quantitative questions • SWBAT choose appropriate scales for graphs • SWBAT identify independent and dependent variables Be able to define: • Correlation, qualitative, quantitative, independent, dependent *DO NOT click "next" until you have completed all notes and activities for this page!*
Quiz Yourself • When you are sure you know your stuff, visit the link below and take the quiz. https://docs.google.com/forms/d/1F0hxb_wOFzsKvbmJO62RLgLQ3BlbVN2yydCOjBHURyA/viewform?pli=1 • This counts as your classwork for the day, so do your best! *DO NOT click "next" until you have completed all notes and activities for this page!*