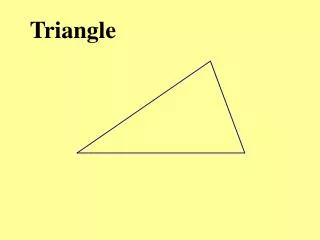
Descending triangle pattern
The Descending Triangle Pattern is a bearish chart pattern that suggests a stocku2019s price may be about to drop. It forms when the price makes lower highs while repeatedly bouncing off a strong support level. This shows that sellers are in control, and buyers are getting weaker.<br><br>If the price breaks below the support level with high volume, it confirms the pattern and signals a potential downtrend. Traders use this pattern to prepare for a possible sell-off or short-selling opportunities.<br><br>Know More:-https://navia.co.in/blog/descending-triangle-pattern-in-technical-analysis/


Descending triangle pattern
E N D
Presentation Transcript
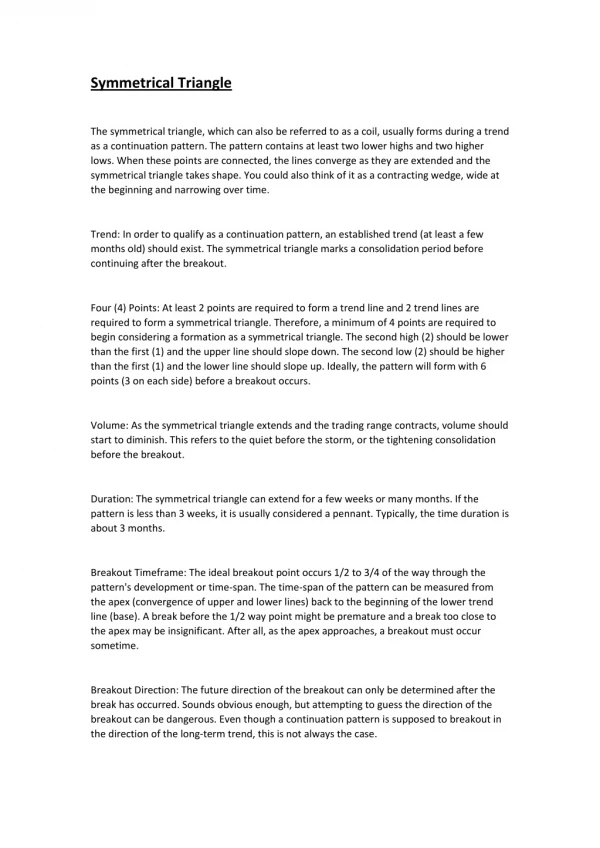
Descending Triangle Pattern A descending triangle pattern illustrating a downward-sloping resistance line converging with a horizontal support line, indicating potential bearish continuation. For more info: https://navia.co.in/blog/descending-triangle-pattern-in-technical-analysis/ Disclaimer: Investment in securities market are subject to market risks, read all the related documents carefully before investing. The securities quoted are for illustrative purposes and are not intended as recommendations. Brokerage will not exceed the SEBI prescribed limit. Navia Markets Ltd ,SEBI Registration No.INZ000095034-NSE Member code for CM, FAO & CD: 07708 - BSE Clearing No. for CM, FAO & CD: 6341-MCX Member ID: 45345 NSDL DP ID: IN300378-CDSL DP ID: 12086500-SEBI Registration No. for DP: IN-DP-311-2017-GST Registration number :33AAACM4739R2ZZ-Registered office: Ganga Griha, 4th & 5th Floor, No.9, Nungambakkam High Road, Chennai - 600 034 Email ID: ig@navia.co.in - Contact No: +91 70100 75500 https://bit.ly/naviadisclaimer