Download
1 / 13
130 likes | 147 Vues
Simple and sensitive batch and FIA-spectrophotometric methods for determination of L- arginine in grape juice samples from different origins, these methods were based on oxidation u00f1 condensation of L u00f1 arginine with u2022 u00f1 naphthol and urea in presence of sodium hydroxide as a medium for amino acid reaction. A red color developed when adding sodium hypo- bromite as oxidizing agent for amino acid. The colored product wassoluble in water and stable for more than 1 hour and the absorbtion was measured at a maximum absorbance at 501 nm. A graphs of peak height versus con- centration show that Beer ,s law was obeyed over the concentration range of 1 u00f1 45 and 3 u00f1 1400 u00b5g.ml -1 of arginine with detection limits of 0.468 and 0.12 u00b5g. ml -1 of arginine for batch and FIA methods respectively. The optimized FIA procedure sample with a throughput of 45 sample / hour.

E N D
id4239390 pdfMachine by Broadgun Software - a great PDF writer! - a great PDF creator! - http://www.pdfmachine.com http://www.broadgun.com Volume 16 Issue 5 ISSN : 0974-7419 Analytical Analytical CHEMISTRY Analytical Analytical CHEMISTRY An Indian Journal Full Paper Full Paper ACAIJ, 16(5) 2016 [192-204] New FIA –spectrophotometric methods for determination of arginine in grape juice samples via sakaguchi reaction after separation with strong cation –exchange resin Bushra B.Qassim, Sarah F.Hameed* University of Baghdad, College of Science,Department of Chemistry, Baghdad, (IRAQ) E-mail: sarahf.hameed@yahoo.com ABSTRACT KEYWORDS Arginine; Flow injection; á– naphthol; Oxidation – condensation reaction; Spectrophotometric determi- nation. Simple and sensitive batch and FIA-spectrophotometric methods for de- termination of L- arginine in grape juice samples from different origins, these methods were based on oxidation – condensation of L – arginine with á– naphthol and urea in presence of sodium hydroxide as a medium for amino acid reaction. A red color developed when adding sodium hypo- bromite as oxidizing agent for amino acid. The colored product was soluble in water and stable for more than 1 hour and the absorbtion was measured at a maximum absorbance at 501 nm. A graphs of peak height versus con- centration show that Beer, s law was obeyed over the concentration range of 1 – 45 and 3 – 1400 µg.ml-1 of arginine with detection limits of 0.468 and 0.12 µg. ml -1 of arginine for batch and FIA methods respectively. The optimized FIA procedure sample with a throughput of 45 sample / hour. All different chemical and physical experimental conditions affecting on the development and stability of the colored product were studied and the proposed methods were applied successfully for the determination of argi- nine in grape juice samples. 2016 Trade Science Inc. - INDIA INTRODUCTION grape juice, is closely related to the levels of ethyl carbamate in wine[4-6]. Ethyl carbamate also known as urethane occurs in wines and some other fermented foods and beverages and is classified as a possible human carcinogen[7,8]. In 1988, the American wine industry has established a voluntary target for EC below 15 µg. L-1 in table wines and below 60 µg.L-1. Arginine is degraded to urea and ornithine by the enzyme arginase via urea. Circle pathway[5]. Some urea is assimilated by the yeast and some is released in to the fermentation medium with excess arginine in grape juice. Accumulated from ethyl carbamate[9- 11]. Citrulline formed by arginine metabolism via argi- Arginine is a conditionally indispensable amino acid[1]. Arginine is a nitric oxide precursor. Nitric oxide is formed from arginine via the enzyme nitric oxide syntheses (NOS)[2]. A significant nutritional problem in preterm in fants is a severe deficiency of arginine (hypoargininemia) which results in hypermmonemia, cardiovascular, pulmonary as well as neurological and intestinal dysfunction. Arginine deficiency may contribute to the high rate of infant morbidity and mortality associated with premature[3]. Arginine one of the most abundant amino acids in
ACAIJ, 16(5) 2016 Bushra B.Qassim and Sarah F.Hameed 193 Full Paper Full Paper nine deiminase pathway by wine malolactic bacte- ria, is the second significant precursor of ethyl car- bamate in wine[12,13]. Urea and Citrulline accumula- tion in the fermentation medium mainly depends on the arginine level and the sort of yeast and malolac- tic bacteria strains[11], if arginine concentration in juici is higher than 1000 µg. L-1, ethyl carbamate con- centration will be potentially above 15µg.L-1 in wine[14] the current voluntary limit in the United State. To avoid potential health hazard of ethyl carbamate in wine, we must determination of the arginine lev- els in grape juice ; is one of the most important steps for wine makers to realize hazard analysis critical control point (HACCP) control. A simple and accurate method for determining the arginine levels in grape juice is the prerequisite for wine makers to take proper measures. Various methods for arginine analysis involve high perfor- mance liquid chromatography[15-17] amino acid ana- lyzer and capillary electrophoresis[18], indirect de- termination by graphate furnace atomic absorption spectrometry[19], fluorimetry[20], isocratic RP – HPLC[21,22], Chemiluminescence[23], MS coupling with atmospheric pressure chemical ionization[24], LC / MS[25]. These methods are mostly slow, expen- sive or required ion pair reagent, derivatisation or laborious sample preparation procedures. The nov- elty of present method is analysis of arginine through the Sakaguchi reaction is specific, sensitive and has been used for determining trace amount of arginine in biological samples. In our experiment, á-naph- thol with urea was selected as the Sakaguchi reagent because the chromogenic product formed in the pres- ence of alkaline hypobromite by the reaction between Sakaguchi reagents with arginine and has been sta- bilized by the reaction occurs at 00C and excess urea was added with á-naphthol when the color devel- oped via FIA / Merging zones system and its absor- bance as peak heigh (mv) was measured at 501 nm. However, the composition of grape juice is so complicated that arginine cannot be directly mea- sure by Sakaguchi reagents due to interference of other compounds. Therefore separation of arginine from grape juice is a very important pretreatment for quantitative analysis. Ion exchange is commonly used to separate amino acids based on their isoelec- tric points. Amino acids are ampholytes with pH dependent net charges. Arginine has the highest iso- electric point (pI = 10.8) among amino acids com- monly found in grape juice. In acidic solution, Arg2+ and Arg1+ can be adsorbed by strong cation – ex- change resins and eluted from the resin by alkaline solution[26]. The purpose of this study was developed simple, accurate and rapid arginine separation method in three types of grape juices from a different origins with Sakaguchi reaction. The developed method could have the application potential in routine quan- tification of arginine in grape growers to monitor and control the level of ethyl carbamate. EXPERIMENTAL Chemicals All chemicals used were of analytical reagent grade and all solution were prepared with distilled water, freshly prepared solutions were always used. A standard solution of L- Arginine (C6H14N4O2, M.wt. 147.2 g.mol-1, BDH)(2000 µg.ml-1 = 1.15x10⁻² M) was prepared (0.4 g) amount of pure arginine was dissolved in a mount of dis- tilled water then completed to 200 ml in a volumet- ric flask with distilled water, more dilution were made when it were necessary. A 10% urea (CH4N2O, M.wt. 60.06 g·mol”1, BDH) prepared by dissolving (10 g) of urea in 100 ml of distilled water in volumetric flask to prepare 1.67 M of urea. A stock solution of á- naphthol (C10H8O, M.wt 144.17g. mol -1, BDH) (1.4x10- 3 M) 0.02g of á- naphthol are dissolved in 95 ml ethanol, and completed to 100 ml in a volumetric flask with distilled water, then take 20 ml of stock solution and completed to 100 ml in a volumetric flask with D.W. A stock solution of sodium hydroxide (NaOH, M.wt 40 g.mol -1, BDH) (2.5 M) was prepared by dissolving 10 g of pure sodium hydrox- ide in 100 ml distilled water in a volumetric flask. Analytical Analytical CHEMISTRY Analytical Analytical CHEMISTRY An Indian Journal
New FIA –spectrophotometric methods for determination of arginine . 194 ACAIJ, 16(5) 2016 Full Paper Full Paper Sodium hypobromite (NaOBr, 0.25M) prepared by dissolving (5 g) of pure sodium hydroxide (1.25M) in 100 ml dis- tilled water, then added (0.64 ml) of Br2 (Bromine). the solution stored in cold and dark. Juice samples preparation Grape samples it has been selected from im- ported samples in the domestic market sample (1) product of Ammerica importer by (farm – pik) com- pany, sample (2) product of Australia imported by (SPT)(Southern Produce Traders), sample (3) prod- uct of Australia imported by (Happy Valley Fruits) company. The samples were cleaned by distilled water, crushed and the juice was clarified by cen- trifugation at 1100 rpm for 20 min at room tempera- ture, then filtered, the filtrate was passed through filter paper to remove any precipitant in the juice. Apparatus & manifold All spectral and absorbance measurements were performed on optima visible SP-300 digital single beam recording spectrophotometer (Japan), for the absorbance measurements as peak height by kompensograph (Siemens) or absorbance with digi- tal millimeter. A quartz flow cell with 75 µl internal volume and 1 cm bath length was inside the detec- tion unit used for absorbance measurements. A one channel manifold was employed for the FIA/mar- gining zones spectrophotometric determination of L- arginine. A peristaltic pump (Master flex C/L, USA) with power supply (Yaxun, 1501 AD, china) was used for to transport the solution, In addition, injec- tion valve (six – three ways homemade which in- cluding three loops made of Teflon) were loaded with chemicals and the reagents solutions, injection valve was employed to provide appropriate volumes of standard solutions and samples. Flexible vinyl tubes of 0.25 mm internal diameter were used for the peristaltic pump. Reaction coil was made of glass with internal diameter of 2mm. Distilled water as carrier (ml. min-1)was combined with injected sample (grape sample L1), and they merged with the reagent(á- naphthol with urea L2) in the presence of (sodium hypobromite solution L3), then mixed in re- action coil with length 50 cm was placed in ice path, injection samples 42.19 µl, flow cell of carrier of 5.5 ml.min-1, the absorbance as high peak was mea- sured at 501nm. For batch procedure, was carried out on shimadzu UV- 1800 (Japan) double beam spectro- photometer and quartz cuvette with an optical path length of 1 cm. For separation of arginine from grape juice we used strong cation exchange resin, Amberlite IR120 (4.2mmol.Kg-1)resin (Na+), particle size 0.4-1.2mm, 46-52% were selected on a preselect ion of differ- ent resins provided by several producers. New res- ins were pretreated with 2 M HCl for 2 hour and then washed with distilled water. Pretreated resin were packed in a column (1.0 cm i.d. x30 cm). Sample (50.0 ml, pH 2.0) was loaded to the column at the rate of 0.5 ml.min-1, then rinsed with distilled water, Finally the sample was eluted with (1 M)NaOH solution at the rate of 2 ml.min-1. Reaction mechanism of the proposed method The proposed mechanism that sodium hypobro- mite oxidizes the guanidine group of arginine and the resulting compound condenses with á- naphthol. a colored solution was obtained as shown in scheme (1) : procedures A/ General batch procedure An increasing concentration (1-45)µg.ml-1 of L- arginine was prepared in to a series of 25 ml volu- metric flask, put in ice bath, then added 1ml of so- dium hydroxide (2.5M) and 1ml of á-naphthol (1.4x10⁻³ M), mix for (2min), then put 0.1ml of cooled sodium hypobromite (0.25M).The standard solutions were shaken for (4second), 1ml of urea (1.67M) was added and mixed. After 10 min, the absorbance of colored product was measured at ëmax = 501 nm against the reagent blank. B/General FIA procedure A L-arginine solution (3-1400)µg.ml-1 was pre- pared from stock solution of 2000 µg.ml-1.The in- jection volumes of [42.19 µl (L1), 43.175 µl (L2), and 54.95 µl (L3)] are consist of grape samples was injected in loop 1, while of 1ml of urea (1.67M) Analytical Analytical CHEMISTRY Analytical Analytical CHEMISTRY An Indian Journal
ACAIJ, 16(5) 2016 Bushra B.Qassim and Sarah F.Hameed 195 Full Paper Full Paper Scheme 1 : The proposed mechanism of the reaction between arginine and á-naphthol in alkaline medium Figure 1 : Schematic diagram of flow injection / merging zones –spectrophotometric analysis P, Prestaltic pump ; I.V, Injection valve ; R.C, Reaction coil ; F.C, Flow cell ; D, Detector (Vis – spectrophotometric) ; W, Waste ; R, Recorder, (L1= grape sample, L2 = á- naphthol with urea, L3 = Sodiumhypobromite) with 1ml of á-naphthol (1.4x10⁻³M) was injected in loop 2. and sodium hypobromite (0.25M) was in- jected in loop 3. Distilled water as carrier of the sample and other chemicals of each loop were car- ried out with flow rate of 5.5 ml. min-1 and reaction coil length of 50cm, as shown in Figure (1). The resulting absorbance of the red product was mea- sured at 501 nm and a calibration curve were con- structed. Optimization of conditions were performed on 35µg.ml-1 of L–arginine. RESULTS AND DISCUSSION Absorption spectra L-Arginine forms a red colored product (ëmax of 501 nm) with á– naphthol in alkaline medium. The absorption spectra of the colored product are given in Figure (2). Analytical Analytical CHEMISTRY Analytical Analytical CHEMISTRY An Indian Journal
New FIA –spectrophotometric methods for determination of arginine . 196 ACAIJ, 16(5) 2016 Full Paper Full Paper Figure 2 : (A) Absorption spectra of the colored product, 20µg.ml-1 of Arginine against reagent blank and (B) blank against distilled water Figure 3 : Continuous variation plot of the reaction between Arginine and á- naphthol using batch procedure Figure 4 : The molar ratio plot for the reaction of Arginine with á-naphthol in an alkaline medium The stoichiometry of the reaction between argi- nine and á-naphthol was investigated under the rec- ommended optimum conditions by(Continuous varia- tion) Job’s method[27] according to the following pro- cedure : in to a series of 25 ml volumetric flasks, increasing volumes (9-1ml) of arginine 20µg.ml-1 were added,followed by putting it in ice then add- ing 1ml of sodium hydroxide (2.5M) and decreasing volumes (1-9 ml) of (1.4x10⁻³M) á-naphthol mix well for (2 min), then added 0.1 ml of sodium hypobro- mite (0.25M), the solution was shaken for 4 sec. then putting 1ml of urea (1.67M) and mixed. After 10 min the absorbance was measured versus reagent blank at ëmax 501 nm as shown in Figure (3). Analytical Analytical CHEMISTRY Analytical Analytical CHEMISTRY An Indian Journal
ACAIJ, 16(5) 2016 Bushra B.Qassim and Sarah F.Hameed 197 Full Paper Full Paper And also a mole ratio method was performed of the reaction, an increased volumes (0.1-2) ml of 1.4x10⁻³M, á-naphthol were added to a 1 ml of 20 µg. ml -1 L- arginine which was oxidation by 0.1ml sodium hypobromite (0.25 M), and reacted with á- naphthol (1.4x10⁻³M) and the colored product was stabilized by adding urea (1.67M). as shown in Fig- ure (4). The result obtained (Figure 3&4) indicate that a (1:2) colored product was formed. Batch spectrophotometric determination The factors affecting on the sensitivity and sta- bility of the colored product which resulting from the reaction between L-arginine and á-naphthol in alkaline medium were investigated.In the subsequent experimental the concentration 20µg.ml-1 was cho- sen as the optimum concentration of arginine to ob- tain the highest absorbance. The effect of different concentration of sodium hydroxide (0.1-1.2M) was carefully studied for the reaction between L-argin- ine and á-naphthol in alkaline medium in the pres- ence of urea and in ice path (50C) to increase the time of Complex stability using sodium hypobromite as oxidizing the guanidine group of L- arginine and resulting compound which condenses with á-naph- thol which described above procedure, 1M NaOH seems to be optimum as shown in Figure (5). The effect of divers concentration of urea on the reaction was investigated, the highest absorbance at 0.3M of urea was found necessary for complete the reaction and it was appropriate for the optimum as shown in Figure (6). The effect of various concentration of á- naph- thol was tested on the maximum formation of the colored product, Figure (7) shown that 8x10⁻⁴M was adequate to gain the maximum absorbance The effect of different concentration of sodium hypobromite was studied.A 0.1M sodium hypobro- mite gave the highest absorbance and was chosen for subsequent experimental, as shown in Figure (8). FIA- spectrophotometric determination The batch method for the determination of L-argi- nine was adopted as a basis to develop a FIA / merg- ing zones system. Optimization of chemical conditions The influence of sodium hydroxide concentra- tion (0.1-3M) was investigated,the result indicate that the best concentration of NaOH is 2.5M at maxi- mum peak height (n=3) mv, as shown in Figure (9) The experiment was done at various á-naphthol concentration of (1x10⁻⁴– 1.5x10⁻³ M) Figure (10) shows the maximum peak height at 1.4x10⁻³M which soluble in ethanol (99%), and was selected as the optimum concentration of reagent as shown in Fig- ure (10). Figure 5 : Effect of the concentration of NaOH in (M) Analytical Analytical CHEMISTRY Analytical Analytical CHEMISTRY An Indian Journal
New FIA –spectrophotometric methods for determination of arginine . 198 ACAIJ, 16(5) 2016 Full Paper Full Paper Figure 6 : Effect of urea concentration in (M) Figure 7 : Effect of á-naphthol concentration in (M) Figure 8 : Effect of concentration of oxidizing agent in (M) From Figure (10) shows that an increase the á- naphthol concentration might be cause decrease in oxidizing reaction of L- arginine. Urea was added to the reaction, it mixed with á- naphthol and loaded Analytical Analytical CHEMISTRY Analytical Analytical CHEMISTRY An Indian Journal
ACAIJ, 16(5) 2016 Bushra B.Qassim and Sarah F.Hameed 199 Full Paper Full Paper Figure 9 : Effect of NaOH conc. in (M) Figure 10 : Effect of á-naphthol concentration in (M) Figure 11 : Effect of Urea concentration in (M) dium hypobromite was studied, the concentration of 0.25M was found to be the ideal value as oxidizing agent of L-arginine with á-naphthol in the existence of urea in ice path (50C), as shown in Figure (12). A preliminary physical condition was used 42.19µl as sample volume (L1) which loaded by L- in loop2 to increase the time of stability of the com- plex formed, therefore the influence of various con- centration was investigated and 1.67M seems to be the perfect absorbance as peak height (n=3) mv as shown in Figure (11). The influence of different concentration of so- Analytical Analytical CHEMISTRY Analytical Analytical CHEMISTRY An Indian Journal
New FIA –spectrophotometric methods for determination of arginine . 200 ACAIJ, 16(5) 2016 Full Paper Full Paper Figure 12 : Effect of different concentration of sodium hypobromite on peak height intensity(mv) Figure 13 : Effect of reaction coil length in (cm) arginine 35µg.ml -1 with adding some drops of so- dium hydroxide 2.5M, 43.175µl of á- naphthol(1.4x10⁻³M) in 1.67M urea (L2) and 54.95 µl of 0.25M sodium hypobromite (L3). It was con- cluded that distilled water can be used as carrier compared with the base was used. Distilled water was preferred as a carrier stream (ml.min -1) with high sensitivity for determination. Optimization of physical conditions The effect of variables such as reaction coil, in- jection volume of reagents and sample and flow rate on the analytical response was investigated. The peak height depends on the residence time of the sample in the system that is affected by flow rate and reac- tion coil lengths, the results during the study of the effect of reaction coil lengths (50,100,150,200) show that by increasing the reaction coil lengths up to 50 cm the sensitivity decrease. At longer distance there was increase in dispersion and it will decrease the peak height. as shown in Figure (13). The effect of variation of sample and reagent volumes were investigated under optimum condi- tions. L-arginine concentration was 35µg.ml-1,á- naphthol (1.4x10⁻³M) with urea(10%), and sodium hypobromite(0.25M). the results obtained indicated that a(42.19,43.175 & 70.25) µl was suitable vol- umes for sample and reagent respectively using dif- ferent lengths of loops and using open valve mode gave the best response as shown in Figure(14). The influence of flow rate on the response of the Analytical Analytical CHEMISTRY Analytical Analytical CHEMISTRY An Indian Journal
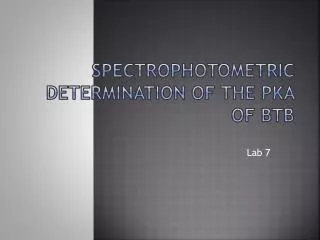
ACAIJ, 16(5) 2016 Bushra B.Qassim and Sarah F.Hameed 201 Full Paper Full Paper Figure 14 : Effect of variation of sample and reagent volumes of a/ L-arginine in NaOH. b/á-naphthol with urea. c/ sodium hypobromite Figure 15 : Effect of flow rate (ml/min) ability and reproducibility of the developed FIA compared with the batch procedure. The FIA-merg- ing zone technique is more convenient than the former method because of its speed (sample through put of 45 injection h-1), wider linear range of calibration graph and good recovery were obtained. Analysis of grape juice samples The suggested methods were applied for the quantitative determination of L-arginine in grape juice samples[29]. Three types from different sources were pretreatment as shown in chemicals, TABLE (2) summarizes the results obtained by the proposed methods. They gave a good accuracy & precision, the proposed methods were compared successfully with the official method[30], since F-test and T- test TABLE (3) indicate that there was no significant dif- ferences between the proposed method and the offi- cial method. The calculated valued for F- test were reaction was studied in the range of 1.1- 6.3 ml.min- 1. The result obtained indicated that a flow rate of 5.5 ml.min-1 of distilled water as carrier gave the highest response as shown in Figure (15). The injection time was also an important condi- tions that effect on the sample throughput and was investigated by calculating the interval time between the sample injection and the appearance of the end of the signal. the reaction time of each samples was 80 sec., therefore the sample through put was 45 sample/hour. Analytical parameters Analytical characteristics such as detection limit, linear range, relative standard deviation and corre- lation coefficient of each method were determined[28] and also explained in TABLE (1), results proof the high sensitivity of the developed procedure. These small points were referred to high repeat- Analytical Analytical CHEMISTRY Analytical Analytical CHEMISTRY An Indian Journal
New FIA –spectrophotometric methods for determination of arginine . 202 ACAIJ, 16(5) 2016 Full Paper Full Paper TABLE 1 : Analytical characteristics of the procedures developed for the determination of L- arginine Parameters Batch method 1-45 y=0.025x+0.243 0.9869 97.78 0.0145 (at 15 ppm) 0.025 0.243 3.9×10⁻³ 0.019 0.468 4.68 4 FIA method 3-1400 y=0.468x+152.5 0.9966 99.3 0.057 (at 60 ppm) 0.468 152.5 0.0185 25.39 0.12 1.186 45 Linear range (µg.mL-1) Regression equation Correlation coefficient (r) Linearity (r2%) Relative standard deviation (RSD%) Slope (b), (ml.µg -1) Intercept (a) Standard deviation of slope (Sb) Standard deviation of intercept (Sa) Limit of detection (LOD) Limit of quantification (LOQ) Sample through put (hr-1) TABLE 2 : Application of the proposed and official methods for the determination of L- arginine in grape juice Proposed methods Official method recovery% Batch FIA-Merging zones Present conc. (µg.ml-1) 20 40 80 20 40 80 20 40 80 Grape juice samples Rec.* % 100 99.5 100.6 98.8 99.91 100 99.2 100.08 100 RSD* % 0.2 0.64 0.99 3.2 0.083 0.023 0.72 1.49 0.00 Rec.* % 100.05 0.084 100 100 100.4 100 99.98 100 99.325 0.729 100.01 0.021 RSD* % Present conc. (µg.ml-1) 5 12 30 5 12 30 5 12 30 Sample (1) product of America Importer by (farm – pik) company Sample (2) product of Australia imported by (SPT) (Southern Produce Traders) sample (3) product of Australia imported by (Happy Valley Fruits) company *Average of three determination TABLE 3 : The comparison of the proposed batch and FIA methods with standard method using T- and F- statical tests 0.025 1.25 0.54 0.00 0.012 0.00 100.1 99.87 100 Proposed methods Batch Rec% (xi-x-)2 Official method Grape juice samples FIA (xi-x-)2 (xi-x-)2 Rec% Rec% 1 1 2 Sample (1) product of America Importer by (farm – pik) company Sample (2) product of Australia imported by (SPT) (Southern Produce Traders sample (3) product of Australia imported by (Happy Valley Fruits) company 2.5x10⁻³ 1x10⁻⁴ 100.03 0.062 100.01 100.1 99.57 0.044 100.1 0.019 99.87 0.012 4x10⁻⁴ Ó(xi-x-)2 0.106 99.76 99.77 0.036 Ó(xi-x)2 0.057 100 0.014 Ó(xi-x-)2 0.026 (xi)1= 99.78 (xi)1= 99.96 (xi)2= 99.99 1= 1= 2= F calculated(Batch) =S1 confidence level, T calculated (Batch) = 0.178, T calculated (FIA)= 0.36, T theoretical = 2.770, T theoretical>T calculated ; at 95% confidence level. (4.33) & (2.08), T-test values were (0.178) & (0.36) 2/S2 2=0.052/0.012= 4.33, F calculated (FIA) = S1 2/S2 2 = 0.025/0.012 = 2.08 ; F theoretical = 19.01, F theoretical > F calculated ; at 95% for the batch and FIA methods respectively, did not Analytical Analytical CHEMISTRY Analytical Analytical CHEMISTRY An Indian Journal
ACAIJ, 16(5) 2016 Bushra B.Qassim and Sarah F.Hameed 203 Full Paper Full Paper 57, 301-306 (1991). M.Vahl; A survey of ethyl carbomate in beverages, Bread and acidified milks sold in Denmark, Food Add.Cantam., 10, 585-592 (1993). C.S.Ough, E.A.Crowell, B.R.Gut love; Carbamyl compound reactions with ethanol, Am.J.Enol.Vitic., 39, 239-242 (1988). [10] S.Kodama, T.Suzuki, S.Fujinawa; Urea contribu- tion to ethyl carbamate formation in commercial wines during storage, Am.J.Enol.Vitic., 45, 17-24 (1994). [11] C.A.Uthurry, J.A.Suarez Lepe; Ethyl carbamate pro- duction by selected yeast and lactic acid bacteria in red wine; Food chem.., 94, 262 – 270 (2006). [12] O.R.Mira de, S.Q.Liu, M.L.Patchett, G.J.Pilone; Ethyl carbamate precursor citrulline formation from arginine degradation by malolactic wine lactic acid bacteria, FEMS Microbiology letters, 183, 31-35 (2000). [13] O.R.Mira de, M.L.Patchett, S.Q.Liu, G.J.Pilone; Growth and arginine metabolism of the wine lactic acid bacteria lactobacillus buchneri and Oenococcus oeni at different pH values and arginine concentra- tions, Applied and Environmental microbiology, 67, 1657–1662 (2001). [14] C.S.Ough, D.Stevens, J.Almy; Preliminary com- ments on effects of grape vineyard nitrogen fertili- zation on the subsequent ethyl carbamate formation in wines, American J.of Enology and viticulture, 40, 219-220 (1989). [15] M.Marra, A.R.Bonfigli, R.Testa; High performance liquid chromatographic assay of a symetric dimethyl arginine, Arginine in human plasma by derivatization with naphthalene -2,3- dicarboxaldehyde, Anal.Biochem., 318, 13-17 (2003). [16] T.Teerlink, R.J.Nijveldt, S.Jong; Determination of arginine, Asymmetric dimethyl arginine and sym- metric dimethyl arginine in human plasma and other biological samples by HPLC, Anal.Biochem., 303, 131–137 (2002). [17] Z.Huang, C.S.Ough; Effect of vineyard locations, Varieties and root stocks on the juice amino acid composition of several cultivars, Am.J.Enol.Vitic., 40, 135-139 (1989). [18] L.Zhang, Y.Liu, G.Chen.; Simultaneous determina- tion of allantion, choline and L – arginine in Rhizoma Dioscoreae by capillary electrophoresis, J.Chromatogr.A., 1043, 317 – 321 (2004). [19] L.Jin, H.Zhu, T.Xu, W.Tong, W.Zhou, Y.Fang; In- direct determination,of arginine by graphite furnace exceed the critical values of F- test = 19.01 and T- test = 2.770 (n1+n2– 2 = 4). These confirming that there are no significant differences between the pro- posed methods and the official method with respect to precision and accuracy in determination of L – arginine in grape juice samples as shown in TABLE (3). [8] [9] CONCLUSION A batch and FIA methods were described for the determination of L- arginine. Although very few methods are available for the determination of L- arginine by spectrophotometric analysis. The pro- posed method are rapid, simple & offers the advan- tages of sensitivity more than all reported spectro- photometric methods, which needed a difficult con- ditions, expensive material & the method that obeyed Beer’s law gave a good application for the grape juice than the other methods which have low linear range[31]. REFERENCES [1] Fao /WHO/UNV; Protein and amino acid require- ments in human nutrition, WHO, press, 150 (2007). [2] J.A.Penelope, M.Bernd; Cardiovascular research, 43(3), 521-531 (1999). [3] W.Guoyao, A.J.Laurie, W.B.Fuller, J.M.Rhoadsc; The Journal of Nutritional Biochemistry, 15(8), 442- 451 (2004). [4] S.E.Spayd, R.L.Wample, R.G.Evans, R.G.Stevens, B.J.Seymour, C.W.Nagel; Nitrogen fertilization of white Riesling grapes in Washington, must and wine composition, American Journal of Enology and viticulture, 45, 34-42 (1994). [5] S.Q.Liu, G.G.Pritchard, M.L.Hardman, G.J.Pilone; Occurrence of arginine deiminase pathway enzymes in arginine catabolism by wine lactic acid bacteria, Applied and Environment Microbiology, 61, 310 – 316 (1995). [6] N.Terrade, de R.M.Orduna; Impact of winemaking practices on arginine and citrulline metabolism dur- ing and after malolactic fermentation, Journal of Applied Microbiology, 101, 406-411 (2006). [7] K.Kitamoto, K.Oda, K.Gomi; Genetic engineering of a sake yeast producting no urea by successive disruption of arginine gene, Appl.Environ.Microbiol., Analytical Analytical CHEMISTRY Analytical Analytical CHEMISTRY An Indian Journal
New FIA –spectrophotometric methods for determination of arginine . 204 ACAIJ, 16(5) 2016 Full Paper Full Paper atomic preconcentration on a niafion chemically modified tungsten coil Analytica, Chimica.Acta., 268(1), 159- 62 (1992). [20] T.Miura, M.Kashiwamura, M.Kimura; A fluoromet- ric method for the specific determination of serum arginine with 2,3-naphthalen dicarbaldehyde, Anal.Biochemistry, 139(2), 432–37 (1984). [21] Huidobro Al, F.J.Ruperez, C.Barbas; Tandem col- umn for the simultaneous determination of arginine, ibuprofen. and related impurities by LC, Journal of chroma.. A., 119, 238- 45 (2006). [22] M.Marra, A.R.Bonfigli, R.Testa, I.Testa, A.J.Gambini, G.Coppa; RP- HPLC assay of asym- metric dimethyl arginine, symmetric dimethyl argin- ine and arginine in human plasma by derivatisation with naphthalene – 2, 3 – dicarboxaldehyde, Anal.Biochemistry, 318, 13–17 (2003). [23] P.S.Francis, N.W.Barnett, R.C.Foitzik, M.E.Gange, S.W.Lewis; Chemiluminescence from the Sakaguchi reaction, Anal.Biochem. 329, 340- 41 (2004). [24] L.F.Huang, F.Q.Guo, Y.Z.Liang, Q.N.Hu, B.M.Cheng; Rapid simultaneous determination of arginine and methylated arginines in human urine by HPLC, MS, Analytica.Chimica. Acta., 487, 145– 53 (2003). [25] Martens J.Lobenhoffer, Bode S.M.Boger; Fast and Efficient determination of arginine, symmetric dim- ethyl arginine and asymmetric dimethyl in biological fluids by hydrophilic, Interaction LC – Electroscopy tandem Mass spectrometry, Clinical Chemistry, 52, 488–93 (2006). [26] L.H.Gan; L.J.Weng, S.B.Wang; Research on the properties of the adsorption of L – arginine by 732 cation exchange resin, Ion Exch.Membr., 18, 559 – 563 (2002). [27] Levie R.De; “Principles of quantitative chemical analysis”, The McGrw-Hill companies, Inc., Singapore, (1997). [28] K.T.Austin, C.E.Butzke; Spectrophotometric assay for arginine ingrape juice and must, Americam, Jour- nal of Enology and viticulture, 51, 227-232 (2000). [29] Hua Li, Xinhong Liang, Lidan Feng1, Yanlin Liu1, Hua Wang; A simple and fast method for arginine determination in grape juice, Journal of Food and Drug Analysis, 16, 3, 53-58 (2008). [30] European pharmacopeia 5.0 “Council of European (COE)” 2007, European Directorate for the quality of medicines (EDQM), Arginine hydrochloride, 0805. [31] X.L.Huali, Y.L.Lidanfenc, W.Hau; A simple and fast method for arginine determination in group juice, Journal of Food and Drug Analysis, 16, 53-58 (2008). absorption spectrometry after Analytical Analytical CHEMISTRY Analytical Analytical CHEMISTRY An Indian Journal