Download
1 / 9
90 likes | 94 Vues
Sensitive and fast-responding potentiometric sensors are described for<br>the determination of warfarin sodium. They consist of PVC matrix mem- branes containing the drug- phosphomolybdate ionophore complexes as<br>electroactive materials and Tetrahydrofuran as a solvent mediator used<br>various plasticizers: oleic acid (OA), tri-n-butylphosphate(TBP), Nitrobenzen (NB), Acetophenone (AP) and di-octyl phthalate (DOPH).. Linear dynamic response range between 1 u00d7 10<br>-1 and 1 u00d7 10<br>-5 M with<br>Nernstian slopes of 21.3u00f131.6 mV/decade concentration and a detection<br>limit of (7u00d710<br>-6 - 2u00d7 10<br>-5) M are obtained, correlation coefficient of<br>0.9969 and 0.9998, the lifetime was (7-35) days respectively. Awide range<br>of inorganic anions, amino acid and drag excipients do not interfere. Titration of the drugs with a standard phosphomolybdate solution using vari- ous sensors in conjunction with an Ag-AgCl working electrode displays<br>S-shaped titration curves with sharp potential breaks at stoichiometric<br>16:2 (drug : phosphomolybdate) reaction. The proposed electrodes were<br>successfully applied to the determination of warfarin in various pharma- ceutical preparations are presented and compared. Several advantages over<br>the pharmacopoeial methods and other techniques in current use are offered by the proposed technique.

E N D
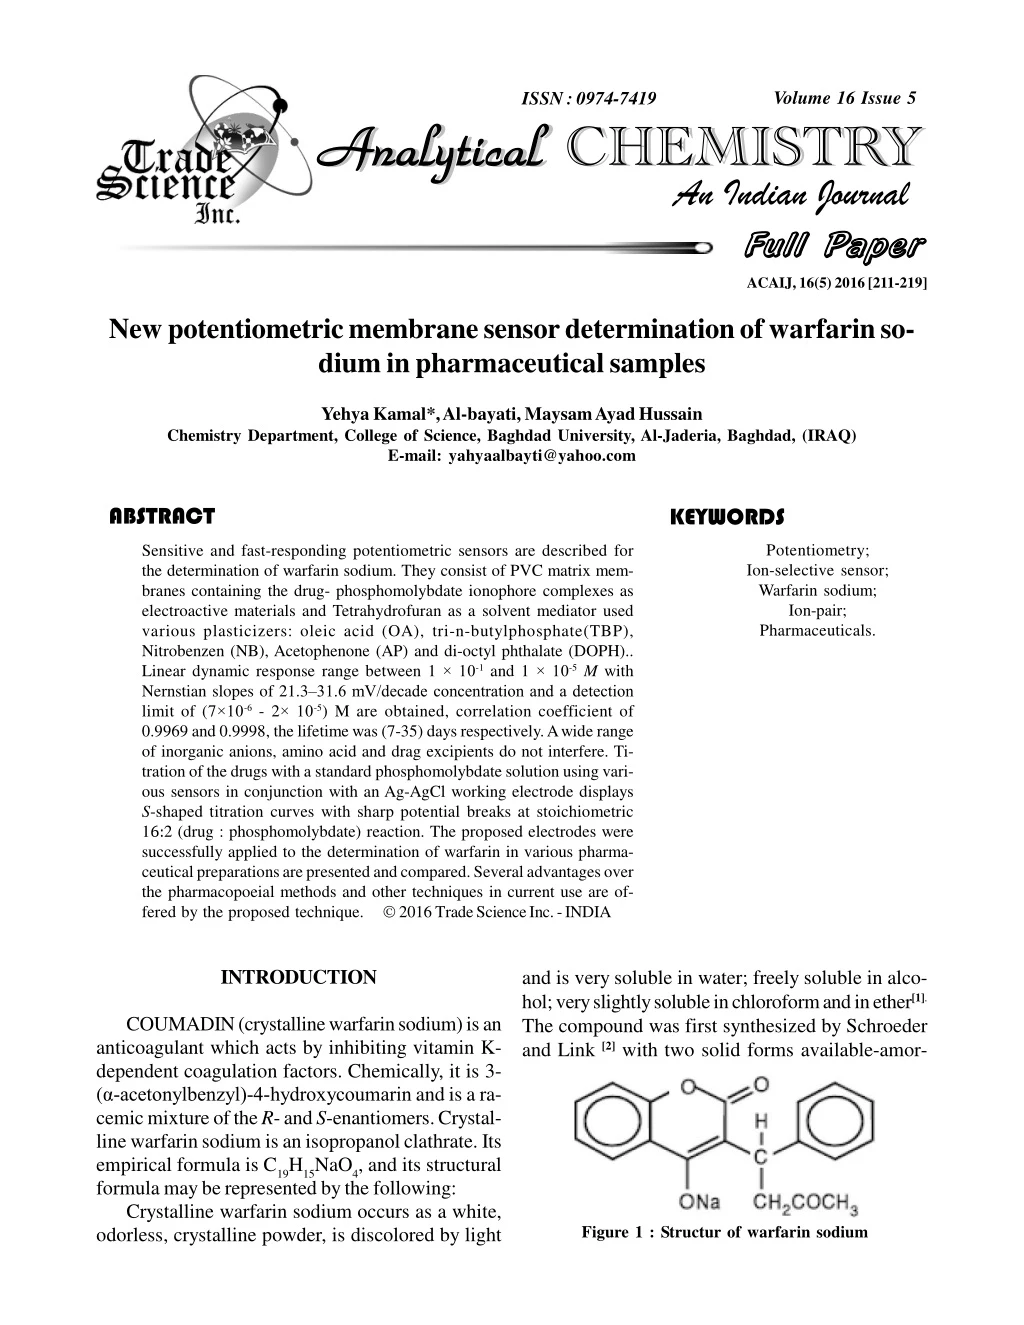
id4333156 pdfMachine by Broadgun Software - a great PDF writer! - a great PDF creator! - http://www.pdfmachine.com http://www.broadgun.com Volume 16 Issue 5 ISSN : 0974-7419 Analytical Analytical CHEMISTRY Analytical Analytical CHEMISTRY An Indian Journal Full Paper Full Paper ACAIJ, 16(5) 2016 [211-219] New potentiometric membrane sensor determination of warfarin so- dium in pharmaceutical samples Yehya Kamal*, Al-bayati, Maysam Ayad Hussain Chemistry Department, College of Science, Baghdad University, Al-Jaderia, Baghdad, (IRAQ) E-mail: yahyaalbayti@yahoo.com ABSTRACT KEYWORDS Potentiometry; Ion-selective sensor; Warfarin sodium; Ion-pair; Pharmaceuticals. Sensitive and fast-responding potentiometric sensors are described for the determination of warfarin sodium. They consist of PVC matrix mem- branes containing the drug- phosphomolybdate ionophore complexes as electroactive materials and Tetrahydrofuran as a solvent mediator used various plasticizers: oleic acid (OA), tri-n-butylphosphate(TBP), Nitrobenzen (NB), Acetophenone (AP) and di-octyl phthalate (DOPH).. Linear dynamic response range between 1 × 10⁻¹ and 1 × 10⁻⁵M with Nernstian slopes of 21.3–31.6 mV/decade concentration and a detection limit of (7×10⁻⁶ - 2× 10⁻⁵) M are obtained, correlation coefficient of 0.9969 and 0.9998, the lifetime was (7-35) days respectively. A wide range of inorganic anions, amino acid and drag excipients do not interfere. Ti- tration of the drugs with a standard phosphomolybdate solution using vari- ous sensors in conjunction with an Ag-AgCl working electrode displays S-shaped titration curves with sharp potential breaks at stoichiometric 16:2 (drug : phosphomolybdate) reaction. The proposed electrodes were successfully applied to the determination of warfarin in various pharma- ceutical preparations are presented and compared. Several advantages over the pharmacopoeial methods and other techniques in current use are of- fered by the proposed technique. 2016 Trade Science Inc. - INDIA INTRODUCTION and is very soluble in water; freely soluble in alco- hol; very slightly soluble in chloroform and in ether[1]. The compound was first synthesized by Schroeder and Link [2] with two solid forms available-amor- COUMADIN (crystalline warfarin sodium) is an anticoagulant which acts by inhibiting vitamin K- dependent coagulation factors. Chemically, it is 3- (á-acetonylbenzyl)-4-hydroxycoumarin and is a ra- cemic mixture of the R- and S-enantiomers. Crystal- line warfarin sodium is an isopropanol clathrate. Its empirical formula is C19H15NaO4, and its structural formula may be represented by the following: Crystalline warfarin sodium occurs as a white, odorless, crystalline powder, is discolored by light Figure 1 : Structur of warfarin sodium
New potentiometric membrane sensor determination of warfarin sodium . 212 ACAIJ, 16(5) 2016 Full Paper Full Paper phous and crystalline clathrate. The amorphous form isstable in ambient conditions. The crystalline clath- rate form is warfarin sodium-isopropyl alcohol com- plex, which is prepared either from warfarin or amorphous warfarin sodium to eliminate impurities in warfarin sodium[3]. The pharmacologic function of the compound is an anticoagulant that inhibits the synthesis of vitamin K-dependent coagulation fac- tors[4]. Warfarin inhibits the action of vitamin K ep- oxide reductase, whose gene (VKORC1) was dis- covered in 2004 by two independent teams[5,6]. In an attempt to decrease the toxicity of warfarin induction,several clinical dosing algorithms have been proposed[7,12], but none has been well accepted. A major barrier to their use is that they were devel- oped for middle-aged inpatients who could tolerate doses of 5–10 mg warfarin dailyand who had daily monitoring of the INR. Today,the typical person tak- ing warfarin is elderly. Because warfarin dose re- quirements decrease with age,use of existing algo- rithms tends to overdose the elderly[13,15]. A solution of 0.1 M warfarin sodium was pre- pared by dissolving 1.65 g of standard and making the solution up to 50 mL with deionized water. Preparation of the WFN-PMA ion-pair WFN-PMA ion-pair was prepared by mixing 50 mL of 0.01 M warfarin sodium with 50 mL of 0.01 M phospho molybdic acid while stirring. The re- sultant precipitate was filtered, washed with water, and allowed dried at room temperature for two days. Electrode membrane preparation and measure- ments The membranes have the composition ion-pair : PVC: plasticizer in the ratio 1:33:66. The electroactive material and the solvent mediator were mixed together, and then the PVC and the appropri- ate amount of THF were added and mixed to obtain a transparent solution. This solution was transferred onto a glass plate of 20 cm2, and the THF was al- lowed to evaporate at room temperature leaving a tough, flexible membrane embedded in a PVC ma- trix. An 8 mm diameter piece of membrane was cut out and assembled on the Fluka electrode body. The measurements were carried out at room temperature using a WTW Instruments Terminal 740 pH/mV- meter. Selectivity measurements A separate solution method was used for the se- lectivity coefficient measurement, and was calcu- lated according to the equation[16] logKpot=[(EB-EA)/(2.303RT/zF)]+(1-zA/zB)logaA EA, EB; zA, zB; and aA,aB are the potentials, charge numbers, and activities for the primary A and inter- fering B ions, respectively, at aA=aB. The selectivity coefficients were also measured by the match method according to the equation[17] Kpot =ÄaA/aB, ÄaA=aA-aA EXPERIMENTAL PART Equipment An expandable ion analyzer (Orion model EA- 940, USA), a pH meter (WTW model pH 522, Ger- many), and a saturated calomel electrode (GallenKamp) were used in this work. Reagents and solutions Warfarin sodium standard was a gift from the State Company of Drug Industries and Medical Ap- pliances (Samara IRAQ-SDI). tablets (1 mg war- farin sodium) (Bristol-Myers Squibb Company, USA) and tablets (3 mg warfarin sodium)(Actavis- )were purchased locally. Oleic acid 98.9% (OA), tri-n-butyl phosphate 97% (TBP), Nitrobenzene 98% (NB), Acetophenone 98% (AP), di-octyl ph- thalate 99% (DOPH) and phospho molybdic acid (PMA) were obtained from Fluka AG, Switzerland. Stock solutions of 0.1 M for each of NaCl, KCl, CaCl2,MgCl2,,FeCl3,AlCl3, Alanine,Glycine,Serine, Proline,phenylalanine and Asparginine were pre- pared. More diluted solutions were prepared by sub- sequent dilution of the stock solutions. (1) (2) RESULTS AND DISCUSSION In this study, improved versions of warfarin so- dium selective electrode by using membranes pre- pared using commercial drugs based on (PMA) the basis of the task was the preparation of the specific ionic liquids. It was investigated phosphate molyb- Analytical Analytical CHEMISTRY Analytical Analytical CHEMISTRY An Indian Journal
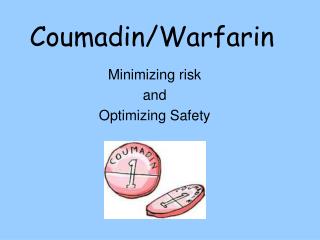
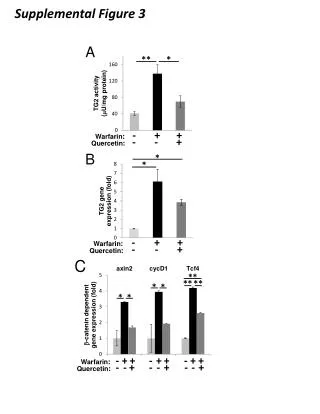
ACAIJ, 16(5) 2016 Yehya Kamal et al. 213 Full Paper Full Paper dic acid in ion-selective electrodes to fully under- stand its functions as both an ionophore and plasti- cizer in potentiometric sensors. The behaviour of potentiometric sensors with carbon paste electrode depends on the composition of the electrode material used and the condition of the contact solution. It is known that the response of an ion selective electrode depends not only on the nature and amount of an ionophore but also on the nature and the amount of the plasticizer. The influ- ence of the plasticizer type and concentration on the characteristics of the studied warfarin sodium elec- trode was investigated using five plasticizers with different polarities, including OA, TBP, NB, AP and DOPH. Different plasticizer/WFN /PMA (w/w) ra- tios were studied to determine the influence of the amount of plasticizer in the electrode. The obtained results are presented in TABLE (1). These results show that the potentiometric responses of the elec- trodes modified with conventional plasticizers were satisfactory, where as those of the proposed elec- trode towards warfarin sodium electrodes were greatly improved in the presence of PMA as both an ionophore and a plasticizer. Warfarin- phosphomolybdate is a stable ion-pair complex which is water insoluble but readily soluble in an organic solvent such as tetrahydrofuran (THF). The obtained complex was incorporated into a PVC membrane with the following plasticizers: oleic acid (OA) (membrane I), tri-n-butylphosphate(TBP) (membrane II), Nitrobenzen (NB) (membrane III), Acetophenone (AP) (membrane IV) and di- octylphthalate (DOPH) (membrane V). The low slope value obtained for membrane(IV)may be at- tributed to the plasticizers used acetophenone (AP) which formation highly conjugated complex, this may decreased the ion-exchange process between the electro-active compound (WFN-PMA) and the ex- ternal solution of warfarin sodium, or may be attrib- uted to the steric factor of the plasticizers (AP) which decreased the bond strength with the electro-active compound. Also the non-Nernstian slope behaviors for membrane(IV) could be attributed to the low vis- cosity of AP (1.68 cST) and lead to leaching of the complex from the membrane to the external pair com- plex (WFN-PMA) in membrane and the external so- lution of warfarin sodium. Near Nernstian slopes were obtained for the electrodes based on OA and TBP (membranes I and II). A typical calibration plot for electrodes I and II are shown in Figure (2). Electrode parameters for oleic acid (OA) as a plasticizer gave a good response that may be due to attributed to the compatibility of the plasticizer used to the electro-active compound from both structure and composition. Also Electrode parameters for TBP as a plasticizer gave a good response that may be attributed to the compatibility of the plasticizer which was used to the electroactive compound from both structure and composition, The electrode had good stability and was used for the quantitative determi- nation of pharmaceutical drugs. Effect of pH on electrodes response The pH of each solution was verified, and its effect on the electrode potential at various warfarin sodium concentrations was studied. For this purpose, several concentrations (1.0×10"2M, 1.0×10"3 M and 1.0×10"4 M) were prepared, and the potential varia- tions of the electrode over a pH range of 1-11 were followed. The pH was adjusted by adding small volumes of hydrochloric acid (1 M) and/or sodium hydroxide (2 M) to the sample solution. The obtained TABLE 1 : Composition and optimization of warfarin sodium selective electrode WFN-PMA (%) 7.0175 PVC (%) 29.8245 63.1578 (OA) Plasticizer (%) Linearity Range/M 1×10⁻⁵_ 1×10⁻¹ Slope (mV dec-1) 31.6 Detection Limit/M 7×10⁻⁶ Life R2 No. time/day 35 I 0.9995 63.1578 (TBP) 1×10⁻⁴_1×10-1 5×10⁻⁵ II 7.0175 29.8245 28.07 25 0.9969 1×10⁻⁵_1×10-1 1×10⁻⁴_1×10-1 5×10⁻⁶ 2×10⁻⁵ III IV 7.0175 7.0175 29.8245 63.1578 (NB) 29.8245 63.1578 (AP) 25.06 21.3 14 7 0.9994 0.9994 63.1578 (DOP) 1×10⁻⁴_1×10-1 6×10⁻⁶ V 7.0175 29.8245 26.4 20 0.9998 Analytical Analytical CHEMISTRY Analytical Analytical CHEMISTRY An Indian Journal
New potentiometric membrane sensor determination of warfarin sodium . 214 ACAIJ, 16(5) 2016 Full Paper Full Paper Figure 2 : (a) calibration curve for warfarin-PMA+OA Figure 2 : (b) calibration curve for warfarine-PMA+TBP Figure 3 : Effect of pH on the potential response of warfarin sodium electrode at concentrations ( 10-2, 10-3 and 10-4) M results are shown in Figure (3). It can be seen that the electrode potential remain almost constant in the pH range of 4-9. The change in potential at higher pH values may be due to the formation of hydroxy complexes of warfarin sodium[18]. At lower pH val- ues, a sharp decrease in the electrode response is observed; this result is due to the protonation of car- boxylic groups on the PMA molecule. Potentiometric selectivity coefficients It is well known that the selectivity behaviour of an electrode is one of the most important factors in its evaluation, which is measured in terms of the selectivity coefficient. The selectivity coefficient not only depends on ion charge and concentration, but it can also be affected by the type of interaction be- tween the ion and the ionophore. The selectivity fac- tor, log kpot is a measure of the preference of ion selective electrode for interfering ion relative to the primary ion to be measured. A selectivity factor log kpot below 1 indicates that the preference is for the primary ion. TABLE (2) show that the electrode ex- hibited better selectivity for the warfarin sodium over a wide variety of other metal ions. The values of the selectivity coefficients, listed in TABLE(2), reflect a very high selectivity of this electrode for warfarin sodium over most of the tested species. Asparginine and phenylalanine caused only slight interference. However, they do not cause any interference at low concentration. This phenomenon suggests a high sta- bility of the complex between warfarin sodium and PMA. The selectivity sequence of the warfarin sodium electrodes employed for different inorganic cations approximately obeys the order: Tri > Di > Mono It is worth mentioning that electrodes have ex- cellent selectivity for the warfarin sodium over other metal ions; this selectivity may be due to the design of PMA to contain negatively charged O-donor groups that enhance its complexing ability for the warfarin sodium over other metals. Here, it is criti- cal to note the existence of a rule of ligand design Analytical Analytical CHEMISTRY Analytical Analytical CHEMISTRY An Indian Journal
ACAIJ, 16(5) 2016 Yehya Kamal et al. 215 Full Paper Full Paper TABLE 2 : Selectivity coefficients for electrodes at different concentration of warfarin sodium for (WFN-PMA+OA) electrode Concentration 10-1M EB (mV) 285.1 4.642×10⁻³ 295.4 1.023×10⁻² 233.1 2.712×10⁻⁵ 225.4 1.502×10⁻⁵ 110.7 1.536×10⁻⁹ 115.7 2.254×10⁻⁹ 150.7 1.537×10⁻⁷ 195.7 4.860×10⁻⁶ 90.1 1.468×10⁻⁹ 200.1 6.813×10⁻⁶ Concentration 10-2M Concentration 10-3M Concentration 10-4M Concentration 10-5M Interfering Ion KA,B EB (mV) KA,B EB (mV) KA,B EB (mV) KA,B EB (mV) KA,B 262.4 9.623×10⁻³ 243.7 1.935×10⁻² 228.1 1.765×10⁻¹ 275.1 2.551×10⁻² 249.4 2.997×10⁻² 222.1 1.113×10⁻¹ 222.1 4.365×10⁻⁵ 211.7 5.248×10⁻⁵ 195.3 1.423×10⁻⁴ 219.4 3.548×10⁻⁵ 202.1 2.512×10⁻⁵ 190.1 9.549×10⁻⁵ 104.7 2.469×10⁻⁹ 95.4 2.199×10⁻⁹ 111.2 4.068×10⁻⁹ 100.7 3.304×10⁻⁹ 147.6 1.434×10⁻⁶ 142.3 8.066×10⁻⁶ 136.5 1.561×10⁻⁴ 190.4 3.831×10⁻⁵ 183.4 1.891×10⁻⁴ 175.4 3.090×10⁻³ 85.7 1.239×10⁻⁸ 79.4 6.456×10⁻⁸ 190.1 3.744×10⁻⁵ 187.3 2.551×10⁻⁴ 170.3 2.089×10⁻³ 211.3 1.096×10⁻¹ 211.7 1.131×10⁻¹ 170.4 1.502×10⁻⁵ 181.4 3.494×10⁻⁵ 81.7 2.427×10⁻⁹ 90.1 4.624×10⁻⁹ 130.1 2.154×10⁻⁴ 168.3 4.043×10⁻³ 64.9 1.445×10⁻⁶ 165.3 3.211×10⁻³ Na+ K+ Ca2+ Mg2+ Fe3+ AL3+ Alanine Glycine Serine Proline 8.954×10⁻⁹ 1.544×10⁻⁸ 89.3 96.4 9.77×10⁻⁷ 70.4 TABLE 3 : Selectivity coefficients for electrodes at different concentration of warfarin sodium for (WFN- PMA+DOPH) electrode Concentration 10-1M EB (mV) 215.2 7.870×10⁻³ 225.3 1.995×10⁻² 100.4 6.368×10⁻⁸ 115.3 2.512×10⁻⁷ 65.3 1.710×10⁻⁹ 55.3 6.808×10⁻¹⁰ 60.2 2.349×10⁻⁷ 104.6 1.663×10⁻⁵ 130.1 1.920×10⁻⁴ 172.3 1.101×10⁻² Concentration 10-2M Concentration 10-3M Concentration 10-4M Concentration 10-5M Interfering Ion KA,B EB (mV) KA,B EB (mV) KA,B EB (mV) KA,B EB (mV) KA,B 1.368×10⁻² 2.208×10⁻² 6.607×10⁻⁸ 3.664×10⁻⁷ 1.862×10⁻⁹ 1.399×10⁻¹⁰ 7.217×10⁻⁷ 5.843×10⁻⁵ 7.943×10⁻⁴ 2.196×10⁻² 175.4 1.614×10⁻² 162.3 1.202×10⁻¹ 150.4 1.306×10⁻¹ 180.1 2.489×10⁻² 157.3 7.586×10⁻² 141.2 5.598×10⁻² 81.7 9.120×10⁻⁸ 72.3 3.019×10⁻⁷ 105.7 8.318×10⁻⁷ 100.7 4.130×10⁻⁶ 55.4 2.553×10⁻⁹ 49.3 7.798×10⁻⁹ 46.2 1.094×10⁻⁹ 39.7 3.221×10⁻⁹ 43.9 5.412×10⁻⁶ 38.7 2.154×10⁻⁵ 90.3 4.641×10⁻⁴ 83.7 1.616×10⁻³ 118.6 7.012×10⁻³ 111.4 2.304×10⁻² 104.7 1.761×10⁻¹ 152.3 1.778×10⁻¹ 135.1 2.239×10⁻¹ 115.4 4.917×10⁻¹ Na+ K+ Ca2+ Mg2+ Fe3+ AL3+ Alanine Glycine Serine Proline 200.1 205.3 92.2 110.8 61.8 51.7 52.7 98.5 125.7 160.3 1.690×10⁻⁷ 2.333×10⁻⁶ 2.612×10⁻⁹ 1.151×10⁻⁹ 9.905×10⁻⁵ 1.271×10⁻² 65.7 94.2 41.3 32.4 26.7 77.3 that permits fairly predictable control of selectivity on the basis of metal ion size. Ionic radius is an important parameter in the formation and stability of metal complexes[19]. Dynamic response time The response time of the electrode is one of the most important characteristics of the ion selective electrode. The IUPAC definition of the response time has changed over time[20,21]. According to IUPAC rec- ommendations, the response time of an ion selective electrode is defined as the time between the addi- tion of the analyte to the sample solution and the time when limiting potential has reached its steady state value within 1± mV. In this study, the response time of the electrode was tested by measuring the time required to achieve a steady state potential (within 1± mV of the final equilibrium value) after successive immersion in a series of warfarin so- dium. The results, shown in TABLE (4) indicate that the response time of the electrodes was approxi- mately (12-49)s for the solution of warfarin sodium in the concentration range of 1×10⁻¹ -1×10⁻⁵ M. This result is probably due to the fast complexation of warfarin sodium by the PMA molecule dispersed in the membrane matrix. Electrodes life time The life time of the electrode depends on the distribution coefficient of the electrode compositions Analytical Analytical CHEMISTRY Analytical Analytical CHEMISTRY An Indian Journal
New potentiometric membrane sensor determination of warfarin sodium . 216 ACAIJ, 16(5) 2016 Full Paper Full Paper TABLE 4 : Response time of warfarin sodium electrodes Time (s) at 95% 12 15 22 27 32 16 21 27 30 38 17 23 31 36 43 19 29 35 42 49 13 17 24 32 38 Time (s) at 100% 13 19 24 30 33 17 23 29 33 40 18 25 32 39 45 20 31 38 45 52 15 20 25 33 40 Membrane composition Concentration (M) Potential (mV) at t/100 10-1 10-2 10-3 10-4 10-5 10-1 10-2 10-3 10-4 10-5 10-1 10-2 10-3 10-4 10-5 10-1 10-2 10-3 10-4 10-5 10-1 10-2 10-3 10-4 10-5 2.1 3.4 4.2 6.4 9.4 3.8 4.1 5.0 6.5 10.9 4.4 4.9 6.7 7.8 9.4 2.7 4.5 5.5 6.7 8.5 2.7 4.5 6.7 8.9 10.5 WFN-PMA+OA (I) WFN-PMA+TBP (II) WFN-PMA+NB (III) WFN-PMA+AP (IV) WFN-PMA+DOPH (V) Sample analysis Potentiometric techniques were used for the de- termination of warfarin sodium, these included di- rect, standard addition (SA), multiple standard ad- dition (MSA), Gran plot, and titration method. Syn- thetic solutions of warfarin sodium at concentrations between 10"3 and 10"4M were used for the standard addition method(22) using oleic acid (OA) and ni- trobenzene (NB) electrodes. The %RC, %RSD, and %RE were calculated and are listed in TABLE(6). The plot of antilog E/S versus the volume of the five addition for 0.1 mL of 1×10⁻¹ Mstandard war- farin sodiumsolution to the 1×10⁻⁴ M warfarin so- dium is shown in Figure (4). Gran plot paper with 10% volume correction was used. The results in TABLE (1)showed that the electrodes based on(OA) and (NB) as plasticizers were the best electrodes. between the aqueous phase and the electrode phase. Accordingly, the life time of the electrode must de- pend on the electrode components. In this work, the life time of the electrode was determined by performing periodic calibrations with standard solutions and calculating the slopes over warfarin sodium concentration ranges of 1×10⁻¹ to 1×10⁻⁶ M. The obtained results showed that the present electrodes have varying lifetime up to 35 days (TABLE 5). During this time, the detection limit of the electrodes are affected by the life time, and the slope of the electrodes response decreases dur- ing this time. Therefore, the electrode(I) can be used for at least two months without a considerable change in its response characteristic towards warfarin so- dium, which may be due to the distribution of mem- brane components are homogeneous helping to reach a short preprocessing of times. Analytical Analytical CHEMISTRY Analytical Analytical CHEMISTRY An Indian Journal
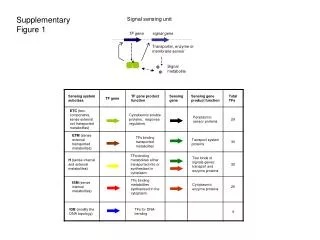
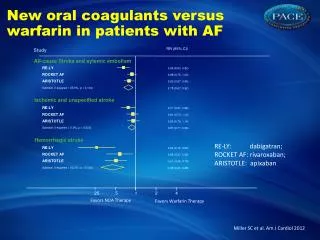
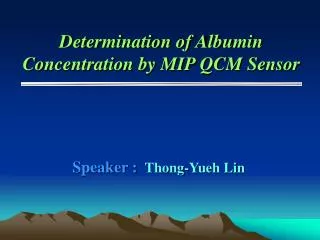
ACAIJ, 16(5) 2016 Yehya Kamal et al. 217 Full Paper Full Paper TABLE 5 : Life time of warfarin sodium electrode Time period Day Slop (mV/decade) Limit of Detection (M) Time period Day Slop (mV/decade) Limit of Detection (M) Time period Day Slop (mV/decade) Limit of Detection (M) Time period Day Slop (mV/decade) Limit of Detection (M) Time period Day Slop (mV/decade) Limit of Detection (M) 7 14 21 30 WFN-PMA-OA (I) 31.6 29.5 26.8 24.8 7×10⁻⁶ 6×10⁻⁶ 5×10⁻⁶ 3×10⁻⁶ 7 14 21 28 WFN-PMA-TBP (II) 28.07 26.8 22.6 _ 5×10⁻⁵ 4×10⁻⁵ 2×10⁻⁵ _ 7 10 21 28 WFN-PMA-NB (III) 25.06 22 _ _ 5×10⁻⁶ 3×10⁻⁶ _ _ 5 14 21 28 WFN-PMA-AP (IV) 21.3 _ _ _ 2×10⁻⁵ _ __ _ 7 14 18 28 WFN-PMA-DOPH (V) 26.4 23.4 21.3 _ 6×10⁻⁶ 4×10⁻⁶ 2×10⁻⁶ _ TABLE 6 : Determination of warfarin -ion samples by potentiometric techniques Concentrations (M) Measurements using potentiometric methods SAM 0.951×10⁻³ 1.008×10⁻³ 0.12* 2.15* 95.1 100.8 -4.9 0.8 0.983×10⁻⁴ 1.002×10⁻⁴ 0.12* 2.6 98.3 98.5 -1.7 0.2 0.997×10⁻³ 0.996×10⁻³ 0.29* 1.08* 97 99.6 -3 -0.4 0.977×10⁻⁴ 1.01×10⁻⁴ 0.32* 2.8* 97.7 101 -2.3 1 Electrode No. Sample Direct MSA 0.983×10⁻³ - 98.3 -1.7 0.976×10⁻⁴ - 97.6 -2.4 0.968×10⁻³ - 96.8 -3.2 0.996×10⁻⁴ - 99.6 -0.4 Titration 0.95×10⁻³ - 95 -5 0.97×10⁻⁴ - 97 -3 0.94×10⁻³ - 94 -6 0.96×10⁻⁴ - 96 -4 1×10⁻³ RSD% RC% RE% 1×10⁻⁴ RSD% RC% RE% 1×10⁻³ RSD% RC% RE% 1×10⁻⁴ RSD% RC% RE% WFN– PMA +OA (I) WFN– PMA + NB (III) * Each measurement was repeated five times Figure (5) shows a typical plot for the titration curve of 0.001 M warfarin sodium standard solu- Analytical Analytical CHEMISTRY Analytical Analytical CHEMISTRY An Indian Journal
New potentiometric membrane sensor determination of warfarin sodium . 218 ACAIJ, 16(5) 2016 Full Paper Full Paper Figure 4 : Plot antilog (E/S) versus the value of the added standard for the determination of warfarin sodium solution (10-4 M) by MSA using (WFN-PMA +NB) electrode Figure 5 : Titration curve of electrode (WFN-PMA +OA) for drug solution containing 0.001 M warfarine sodium with 0.001 M of PMA as titrant solution at PH 8.0 TABLE 7 : warfarin sodium tablets analyses for electrode (WFN-PMA+OA) and (WFN– PMA + NB) Electrod NO. Parameter Concentration(M) Found(M) RSD% RC% RE% Concentration(M) Found(M) RSD% RC% RE% Actavis (tablet) 1×10⁻³ 0.95×10⁻³ 0.15 95 -5 1×10⁻³ 0.969×10⁻³ 0.31 96.9 -3.1 Bristol (tablet) 1×10⁻³ 0.949×10⁻³ 0.16 94.9 -5.1 1×10⁻³ 0.973×10⁻³ 0.3 97.3 -2.7 1×10⁻⁴ 0.976×10⁻⁴ 0.14 97.6 -2.4 1×10⁻⁴ 1.02×10⁻⁴ 0.28 102 2 1×10⁻⁴ 0.975×10⁻⁴ 0.15 97.5 -2.5 1×10⁻⁴ 0.97×10⁻⁴ 0.24 97 -3 WFN– PMA +OA (I) WFN– PMA + NB (III) tion with 0.001 M phsophomolybdic acid as a ti- trant using the warfarin sodium electrode based on membrane containing (OA) plasticizer. The electrodes based on (OA) and (NB) as plas- ticizers appearance good parameters therefore ap- plied for pharmaceutical samples. The direct poten- tiometric method was applied for the determination of warfarin sodium in pharmaceutical tablet (actavis) and (Bristol) as listed in TABLE (7) using the elec- trode based on membrane (I) and (III). The average Analytical Analytical CHEMISTRY Analytical Analytical CHEMISTRY An Indian Journal
ACAIJ, 16(5) 2016 Yehya Kamal et al. 219 Full Paper Full Paper men in elderly inpatients, Age Ageing, 29, 31–34 (2000). [10] M.B.O’Connell, P.R.Kowal, C.J.Allivato, T.L.Repka; Evaluation of warfarin initiation regi- mens in elderly inpatients, Pharmacotherapy, 20, 923–930 (2000). [11] G.W.Roberts, T.Druskeit, L.E.Jorgensen et al.; Com- parison of an age adjusted warfarin loading protocol with empirical dosing and Fennerty’s protocol, Aust N Z J Med., 29, 731–736 (1999). [12] A.Oates, P.R.Jackson, C.A.Austin, K.S.Channer; A new regimen for starting warfarin therapy in out- patients, Br J.Clin.Pharmacol., 46, 157–161 (1998). [13] A.S.Go, E.M.Hylek, K.A.Phillips et al.; Prevalence of diagnosed atrial fibrillation in adults: national im- plications for rhythm management and stroke pre- vention: the anticoagulation and risk factors in atrial fibrillation (ATRIA) study, JAMA, 285, 2370–2375 (2001). [14] A.Majeed, K.Moser, K.Carroll; Trends in the preva- lence and management of atrial fibrillation in gen- eral practice in England and Wales, 1994–1998: analysis of data from the general practice research database, Heart, 86, 284–288 (2001). [15] J.Gurwitz, J.Avorn, Ross D.Degnan; Choodnovskiy I, Ansell J; Aging and the anticoagulant response to warfarin therapy, Ann Intern.Med., 116, 901–904 (1992). [16] Y.Umezaw, P.Buhlmann, K.Umezawa, K.Tohda, S.Amemiya; Pure.Appl.Chem., 72, 1851-2082 (2000). [17] K.Tohda, D.Dragoe, M.Shibata, Y.Umezawa; Anal.Sci., 17, 733-742 (2001). [18] A.A.Ensafi, S.Meghdadi, S.Sedighi; Sensitive cad- mium potentiometric sensor based on 4-hydroxy salophen as a fast tool for water samples analysis, Desalination, 242, 336-345 (2009). [19] R.D.Hancock, A.E.Martell; Ligand design for se- lective complexation of metal ions in aqueous solu- tion, Chemical Reviews, 89, 1875-1914 (1989). [20] C.Couto, M.Montenegro; Potentiometric detectors for flow injection analysis systems, Evolution and application, Quim.Nova, 23, 774-784 (2000). [21] R,P,Buck, V.Cosofret; Recommended procedures for calibration of ion-selective electrodes, Pure and Applied Chemistry, 65, 1849-1858 (1993). [22] Ch.C.Rundl; “A Beginners guide to ion selective elec- trodes measurement”, Nico2000 Ltd.London, UK, (2004). recovery for warfarin sodium determination in tab- lets was around (96.2-98.3)% with a relative stan- dard deviation of about(0.15-0.28) %, based on an average of 5 measurements for each sample. CONCLUSIONS The membranes incorporating CD carrier have many advantages including: easy preparation, low cost, wide dynamic range, low detection limit, suit- able pH range, Nernstian behavior and good repro- ducibility. The sensor is used successfully to deter- mine the warfarin sodium in pharmaceutical samples with satisfactory results. REFERENCES [1] U.Yasar, E.Eliasson, M.Dahl, I.Johansson, Ingelman M.Sundberg, F.Sjoqvist; Validation of methods for CYP2C9 genotyping: Frequencies of mutant alleles in Swedish population, Biochem Biophys Res Comm.1999;254:628-631. [2] C.H.Schroeder, K.P.Link; inventors, Wisconsin alumni research foundation, Warfarin sodium, US patent 3 077 481.February, 12, (1963). [3] U.S.Pharmacopoeia; The national formulary, USP 24/NF19.United states pharmacopoeia convention, Rockville, Md, (2000). [4] Physicians desk reference ®, Medical economics company, Inc; Montvale, NJ, 54th Edition 969-974 (2000). [5] T.Li, C.Y.Chang, D.Y.Jin, P.J.Lin, A.Khvorova, D.W.Stafford; Identification of the gene for vitamin K epoxide reductase, Nature, 427, 541–544 (2004). [6] S.Rost, A.Fregin, V.Ivaskevicius et al.; Mutations in VKORC1 cause warfarin resistance and multiple co- agulation factor deficiency type 2, Nature, 427, 537– 541 (2004). [7] A.Fennerty, J.Dolben, P.Thomas et al., Flexible in- duction dose regimen for warfarin and prediction of maintenance dose, Br Med J (Clin.Res.Ed), 288, 1268–1270 (1984). [8] L.Harrison, M.Johnston, M.P.Massicotte, M.Crowther, K.Moffat, J.Hirsh; Comparison of 5- mg and 10-mg loading doses in initiation of warfarin therapy, Ann.Intern.Med., 126, 133–136 (1997). [9] J.Gedge, S.Orme, K.K.Hampton, K.S.Channer, T.J.Hendra; A comparison of a low-dose warfarin induction regimen with the modified Fennerty regi- Analytical Analytical CHEMISTRY Analytical Analytical CHEMISTRY An Indian Journal