Download
1 / 11
110 likes | 124 Vues
Simple,Accurate,selective and sensitive spectrophotometric methods have been developed and validated for determination of cefadroxil in presence of its alkaline degradation product without preliminary separation. These methods include area under the curve method (AUC), Q-Analysis method (QA), ratio derivative method, Ratio difference method and Mean centering method. These methods were validated and successfully applied to the determination of Duricefu00c6 500mg capsule. The obtained results were statistically compared with those of the reported method by applying ttest and F-test at 95% confidence level and no significant difference was observed regarding accuracy and precision.

E N D
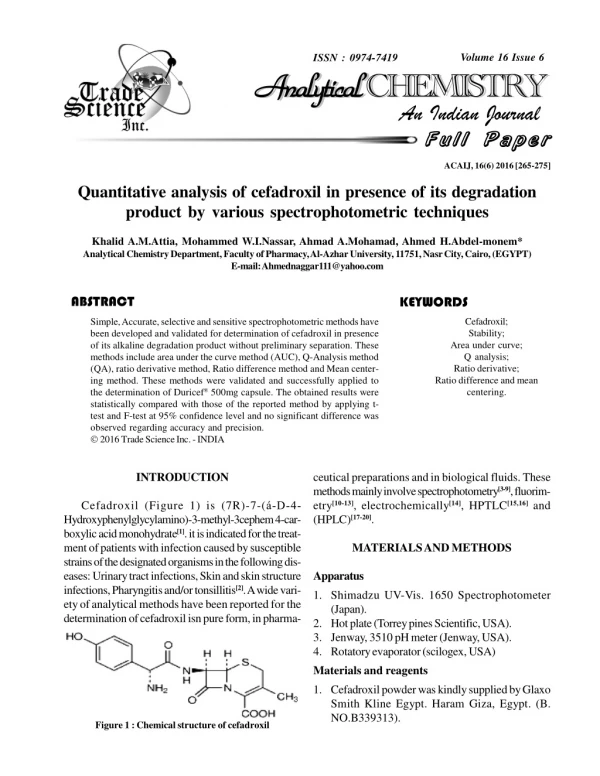
id9158234 pdfMachine by Broadgun Software - a great PDF writer! - a great PDF creator! - http://www.pdfmachine.com http://www.broadgun.com Volume 16 Issue 6 ISSN : 0974-7419 Analytical Analytical CHEMISTRY Analytical Analytical CHEMISTRY An Indian Journal Full Paper Full Paper ACAIJ, 16(6) 2016 [265-275] Quantitative analysis of cefadroxil in presence of its degradation product by various spectrophotometric techniques Khalid A.M.Attia, Mohammed W.I.Nassar, Ahmad A.Mohamad, Ahmed H.Abdel-monem* Analytical Chemistry Department, Faculty of Pharmacy, Al-Azhar University, 11751, Nasr City, Cairo, (EGYPT) E-mail: Ahmednaggar111@yahoo.com ABSTRACT KEYWORDS Cefadroxil; Stability; Area under curve; Q analysis; Ratio derivative; Ratio difference and mean centering. Simple, Accurate, selective and sensitive spectrophotometric methods have been developed and validated for determination of cefadroxil in presence of its alkaline degradation product without preliminary separation. These methods include area under the curve method (AUC), Q-Analysis method (QA), ratio derivative method, Ratio difference method and Mean center- ing method. These methods were validated and successfully applied to the determination of Duricef® 500mg capsule. The obtained results were statistically compared with those of the reported method by applying t- test and F-test at 95% confidence level and no significant difference was observed regarding accuracy and precision. 2016 Trade Science Inc. - INDIA INTRODUCTION ceutical preparations and in biological fluids. These methods mainly involve spectrophotometry[3-9], fluorim- etry[10-13], electrochemically[14], HPTLC[15,16] and (HPLC)[17-20]. Cefadroxil (Figure 1) is (7R)-7-(á-D-4- Hydroxyphenylglycylamino)-3-methyl-3cephem 4-car- boxylic acid monohydrate[1]. it is indicated for the treat- ment of patients with infection caused by susceptible strains of the designated organisms in the following dis- eases: Urinary tract infections, Skin and skin structure infections, Pharyngitis and/or tonsillitis[2]. A wide vari- ety of analytical methods have been reported for the determination of cefadroxil isn pure form, in pharma- MATERIALS AND METHODS Apparatus 1. Shimadzu UV-Vis. 1650 Spectrophotometer (Japan). 2. Hot plate (Torrey pines Scientific, USA). 3. Jenway, 3510 pH meter (Jenway, USA). 4. Rotatory evaporator (scilogex, USA) Materials and reagents 1. Cefadroxil powder was kindly supplied by Glaxo Smith Kline Egypt. Haram Giza, Egypt. (B. NO.B339313). Figure 1 : Chemical structure of cefadroxil
Quantitative analysis of cefadroxil in presence of its degradation product . 266 ACAIJ, 16(6) 2016 Full Paper Full Paper 2. Duricef® 500mg capsule. The product of Glaxo Smith Kline Egypt. Haram Giza, Egypt. (B. NO.N104546). which labeled to contain 500 mg Cefadroxil per capsule. 3. Hydrochloric acid, Sodium hydroxide and Methanol (El-Nasr Co., Egypt). 4. Distilled water Standard solutions A stock solution of cefadroxil (100 µg ml-1) was prepared by dissolving 10 mg of cefadroxil in 50 ml of distilled water and complete to 100 ml with distilled water and was further diluted with distilled water as appropriate. Degraded sample[7] Alkaline-induced forced degradation was performed by adding 100 mg of cefadroxil to 100 ml of 1 N sodium hydroxide and leaving for thirty minutes at room temperature. The solution was then neutralized to pH 7 by addition of 1 N hydrochloric acid solution, evaporated to dryness, the residue was extracted three times with 25 mlmethanol, filtered into 100 ml volumetric flask then the volume was adjusted to the mark by the same solvent. The obtained solution was claimed to contain (1 mg ml-1). and their area under the curve were measured at the selected wavelength ranges. Concentration of cefadroxil in mixed standard solution were calculated using the corresponding equations. The Graphical Absorption Ratio (Q-Analysis) method Aliquots from cefadroxil and its degradate working solutions (100 µg ml-1) equivalent (50–500µg ml-1) were accurately transferred into two separate sets of 10-mL volumetric flasks and completed to the mark with distilled Water. The zero order absorbance of each set was scanned in the range of 200–400 nm and stored in the computer. The absorbance were measured at 250 nm (ë max of cefadroxil) and 275.2 nm (iso-absorptive point). the absorptivity values for cefadroxil and its alkaline degradate at the selected wavelengths were calculated. The method employs Q values and the concentrations of the studied drug in the prepared mixed solutions were determined by using the following equations: Cx =[(Qm– Qy)/(Qx– Qy)] x Aiso/aiso. Ratio derivative method Aliquots from cefadroxil and its degradate working solutions (100 µg ml-1) equivalent (50–500µg ml-1) were accurately transferred into two separate sets of 10-mL volumetric flasks and completed to the mark with distilled water. The spectra of the prepared standard solutions are scanned from 200 - 400 nm and stored in the computer. For the determination of cefadroxil in presence of its degradation product, the stored spectra of cefadroxil are divided by the spectrum of 20 µg ml-1 degradate, to obtain the ratio spectra, then The first derivative of the obtained ratio spectra was employed. The calibration curve was constructed relating the amplitudes of the first derivative values to the corresponding concentrations in µg ml-1 of Cefadroxil at 234 nm, the regression equation was derived. Ratio difference To the ratio spectra obtained as in ratio derivative, The amplitude difference at 251 and 233nm (ÄP 251 - 233) was plotted against the corresponding cefadroxil concentration in µg ml-1 and the regression equation was computed. Mean centering method The ratio spectra obtained as before in ratio GENERAL PROCEDURES Methods Area under the curve method Aliquots from cefadroxil and its degradate working solutions (100 µg ml-1) equivalent to (50–500µg ml-1) were accurately transferred into two separate sets of 10-mL volumetric flasks and completed to the mark with distilled Water. The zero order absorbance of each set was scanned in the range of 200–400 nm. Area under the curve for the wavelength ranges selected for determination of cefadroxil and its degradate are 223– 233 nm (ë1–ë2) and 265–275 nm (ë3–ë4), the absorptivity ‘Y’ values of each of the cefadroxil and its degradate were determined at the selected wavelength ranges. The absorptivity ‘Y’ values were determined as,Y = area under curve of component (from 223 to 233nm or 265 to 275 nm)/concentration of the component (in µg ml-1). Mixed standard were prepared Analytical Analytical CHEMISTRY Analytical Analytical CHEMISTRY An Indian Journal
ACAIJ, 16(6) 2016 Ahmed H.Abdel-monem et al. 267 Full Paper Full Paper derivative method were mean centered using MATLAB. The calibration curve was constructed relating the amplitudes of the mean centered values to the corresponding concentrations of cefadroxil at 243 nm. the regression equation was derived. Analysis of pharmaceutical preparation five Duricef® 500mg capsule were accurately weighed and finely powdered, then a quantity equivalent to 10 mg of cefadroxil was shaken three times with 25 ml methanol 10 minutes then filtered into 100 ml volumetric flask and the volume was adjusted to the mark with distilled water to obtain a concentration of (100 µg ml-1). The solution was analyzed using the procedure described under previous methods. advantage of being simple and selective for determination of cefadroxil in presence of its alkaline degradation with minimal sample and data manipulation. Selection of the wavelength region to construct AUC method has a great effect on the analytical parameters such as slope, intercept and correlation coefficient. Different wavelength regions were tested where the wavelength ranges 223– 233 nm and 265–275 nm were selected which showed good selectivity and percentage recovery (Figure 3). Area under curve of the absorption spectra in the wavelength ranges 223–233 nm (ë1–ë2) and 265–275 nm (ë3–ë4) were calculated for both cefadroxil and its alkaline degradate in the concentration range of (5–50 µg ml-1) The absorptivity ‘Y’ values of cefadroxil and its alkaline degradate were calculated at each wavelength range. The concentrations of cefadroxil in presnce of its alkaline degradate can be obtained by applying Cramer’s rule and matrices in Eqs. (1) and (2). A1 =0.3000 Ccf + 0.238 CD —at 223–233 nm (ë1–ë2) A2 = 0.164 Ccf + 0.115CD —at 265–275 nm (ë3–ë4) where Ccf and CD are the concentrations of cefadroxil and its alkaline degradation in µg ml-1, respectively. 0.3000 and 0.164 are the absorptivity (Y value) of cefadroxil at (ë1–ë2) and (ë3–ë4), respectively. 0.238 and 0.115 are absorptivity (Y value) of cefadroxil degradate at (ë1–ë2) and (ë3–ë4), respectively. A1 and A2 are the area under curve of sample solutions at the RESULTS AND DISCUSSION Spectral characteristics The zero order (D0) absorption spectra of cefadroxil (50 µg ml-1), its alkaline degradation product (50 µg ml- 1) and their mixture containing equal concentration of them (25µg ml-1 of each) were recorded against distilled Water as blank over the range of 200 – 400 nm. (Figure 2) Area under the curve method[21] The proposed area under the curve method has the Figure 2 : Zero - Order Spectra of Intact cefadroxil ( 50µg ml-1)(¯), its alkaline degradate ( 50 µg ml-1) (…..) and Their Mixture (25 µg ml-1 of each) ( ––). Analytical Analytical CHEMISTRY Analytical Analytical CHEMISTRY An Indian Journal
Quantitative analysis of cefadroxil in presence of its degradation product . 268 ACAIJ, 16(6) 2016 Full Paper Full Paper Figure 3 : Zero order absorption spectra of (50 µgml-1) cefadroxil showing wavelength ranges for area under curve method using distilled Water as a Blank. wavelength range at (ë1–ë2) and (ë3–ë4) respectively. The graphical absorption ratio (Q-Analysis) method[22] This method depends on the property that for the substance that obeys Beer’s Lambert’s law at all wavelengths, the ratio of absorptivity (or absorbance) values at any two wavelengths are constant, independent of the concentration or path length. This ratio is referred as Q-ratio[23]. One of the two selected wavelengths is an isoabsorptive point and the other is the wavelength of maximum absorption of the drug. the overlain spectra of cefadroxil, its alkaline degradate and their mixture,(Figure 2), show isoabsorptive points at 275.2 nm. The absorbance values at 275.2nm (ëiso) and 250 nm (ëmax) for cefadroxil and its alkaline degradate in the range of 5–50 µg ml-1 were measured, absorptivity coefficients were determined for both and the average values were taken. The values and the absorbance ratio were used to develop the following equation from which the concentration of cefadroxil in the sample mixture can be calculated: Cx =[(Qm– Qy)/(Qx– Qy)] x Aiso/aiso where Cx is the concentrations of cefadroxil in µg ml-1; Qm is the absorbance of sample at ë250/absorbance of sample at ë275.2; Qx is the mean of absorptivity of cefadroxil at ë250/mean of absorptivity of cefadroxil at ë275.2; Qy is the mean of absorptivity of cefadroxil degradate at ë250/mean of absorptivity of cefadroxil degradate at ë275.2; Aiso is the absorbance of the sample at ë275.2 and aiso is the mean of absorptivity of cefadroxil at ë250. Ratio derivative method[24] Upon dividing the absorption spectrum of a compound by a spectrum of the same compound, a straight line of constant amplitude (parallel to the baseline) will result. However, upon dividing the absorption spectrum of a compound (X) by the absorption spectrum of another compound (Y), a new spectrum (ratio spectrum) will result. The amplitude of the first or second derivative of the ratio spectrum at a maximum or a minimum is proportional to concentration of X without interference from Y. In this method, the absorption spectra of cefadroxil were divided by the absorption spectrum of the degradate (20 ìg/ml) as a divisor to get the ratio spectra, as shown in Figure (4). The amplitudes of the first derivative of the ratio spectra at 234 nm are proportional to the concentrations of the drug without interference from its degradate. as shown in Figure(5). Ratio difference[25] In this method, the absorption spectra of the drug Analytical Analytical CHEMISTRY Analytical Analytical CHEMISTRY An Indian Journal
ACAIJ, 16(6) 2016 Ahmed H.Abdel-monem et al. 269 Full Paper Full Paper Figure 4 : Ratio Spectra of cefadroxil (5-50 µg ml-1) using (20 µg ml-1) of cefadroxil Degradate as a Divisor and distilled Water as a Blank. Figure 5 : First Derivative of Ratio Spectra of cefadroxil ( 5-50 µg ml-1) Using (20 µgml-1) cefadroxil Degradate as a Divisor and distilled water as a Blank Analytical Analytical CHEMISTRY Analytical Analytical CHEMISTRY An Indian Journal
Quantitative analysis of cefadroxil in presence of its degradation product . 270 ACAIJ, 16(6) 2016 Full Paper Full Paper were divided by a suitable absorption spectrum of the degradate (divisor) to get the ratio spectra. Different concentrations of divisor (cefadroxil degradate) are used (10,20,25,30 and40 µg ml-1) and the divisor concentration 20 µg ml-1of cefadroxil degradate is found the best regarding average recovery percent. The difference in peak amplitudes between two selected wavelengths in the ratio spectra is proportional to the concentration of the cefadroxil without interference from its degradate (Figure 4). The method comprises two critical steps, the first is the choice of the divisor. The selected divisor should compromise between minimal noise and maximum sensitivity. The second critical step is the choice of the wavelengths at which measurements are recorded. Any two wavelengths can be chosen provided that they exhibit different amplitudes in the Figure 6 : Mean Centered Ratio Spectra of cefadroxil (5-50 µg ml-1) Using ( 20 µg ml-1 )of its Degradate as a Divisor and distilled Water as a Blank TABLE 1 : Spectral data for determination of the studied drug by the proposed methods Parameters AUC Q analysis Ratio derivative Ratio difference Mean centering 223-233 Wavelength (nm) 250&275.2 234 251&233 243 265-275 Linearity range (µgml-1) 5-50 5-50 5-50 5-50 5-50 LOD (µgml-1) 0.720 0.406 0.256 0.355 0.259 LOQ (µgml-1) 2.184 1.230 0.778 1.078 0.784 Regression equation* Slope (b) 0.1463 0.0115 0.0034 0.0205 0.068 Intercept (a) 0.2697 0.0245 0.0045 0.0368 0.0897 Correlation coefficient (r2) 0.9999 0.9998 0.9997 0.9999 0.9998 * y= bx + a where y is the response and x is the concentration Analytical Analytical CHEMISTRY Analytical Analytical CHEMISTRY An Indian Journal
ACAIJ, 16(6) 2016 Ahmed H.Abdel-monem et al. 271 Full Paper Full Paper TABLE 2 : Intra-day and inter-day accuracy and precision for the determination of the cefadroxil by the proposed methods Intra-day Inter-day Conc. Method Found Accuracy Precision Found Accuracy Precision g.ml-1 Conc. + SD (R%) (RSD%) Conc. + SD (R%) (RSD%) 15 15.08±0.007 100.55 0.045 15.17±0.079 101.11 0.518 25 25.09±0.236 100.36 0.943 25.13±0.197 100.52 0.783 A UC 35 35.35±0.044 101.01 0126 35.51±0.134 101.46 0.378 15 15.02±0.181 100.19 1.204 15.00±0.080 100 0.579 25 24.82±0.173 99.30 0.700 24.85±0.050 99.42 0.201 Q A 35 35.28±0.351 101.82 0.995 35.28±0.181 100.82 0.512 25 24.85± 0.294 99.41 1.183 25.14± 0.29 100.58 1.169 35 34.85± 0.294 99.57 0.843 35.34± 0.16 100.98 0.480 Ratio derivative 45 45.04± 0.612 100.10 1.359 45.04± 0.74 100.10 1.643 15 14.92± 0.122 99.46 0.822 15.01± 0.028 100.11 0.187 25 24.83± 0.341 99.35 1.374 24.98± 0.212 99.94 0.851 Ratio difference 35 35.11± 0.43 100.32 1.252 35.24± 0.149 100.70 0. 422 25 24.91± 0.233 99.66 0.938 25.18± 0.352 100.72 1.401 35 34.76± 0.324 99.33 0.933 35.35± 0.331 101.00 0.938 Mean centering 45 44.76± 0.200 99.47 0.447 44.97± 0.389 99.93 0.865 ratio spectrum and good linearity is present at each wavelength individually. The selected wavelengths are 251and 233 nm (ÄP 251-233 nm) which gave the best results. Mean centering method[26] This method depend on the fact that mean centering of constant equal zero. If the spectrum of a mixture of two compounds X and Y is divided by a standard spectrum of Y as a divisor (Y’), a ratio spectrum will result and therefore: P = AX /AY’+ AY /AY’ Where, P is the amplitude of the mixture in the ratio spectrum. AX, AY and AY’ are the absorbance values of X, Y and divisor (Y’), respectively. Mean centering of equation (1) will lead to: MC (P) = MC (AX /AY’) + MC (AY /AY’) Since AY /AY’ is a constant value, so its mean centering is equal to zero and therefore: MC (P) = MC (AX /AY’) From this equation we note that the mean centering value will related to the X component only. so for determination of cefadroxil in a mixture with its degradation product the mixture was divided by a suitable absorption spectrum of the degradate (divisor) to get the ratio spectra (Figure 4) then the obtained ratio spectra were mean centered using MATLAB and the concentration of cefadroxil was determined by measuring the amplitude at 243 nm (Figure 6). (2) (3) (1) Analytical Analytical CHEMISTRY Analytical Analytical CHEMISTRY An Indian Journal
Quantitative analysis of cefadroxil in presence of its degradation product . 272 ACAIJ, 16(6) 2016 Full Paper Full Paper TABLE 3 : Determination of cefadroxil in presence of its alkaline degradate in their laboratory mixtures by the proposed methods Intact Degradate Intact found Method Percent of degradate Recovery % of intact in (µg ml-1) In (µg ml-1) in (µ ml-1) 45 5 10 % 44.82 99.61 35 15 30 % 34.64 98.99 AUC 25 25 50 % 24.77 99.10 10 40 80 % 9.88 98.86 Mean ± SD% 99.14±0.33 45 5 10 44.78 99.51 35 15 30 34.84 99.55 25 25 50 25.15 100.61 QA 15 35 70 15.29 101.98 Mean ± SD% 100.41±1.157 45 5 10 45.14 100.32 35 15 30 35.14 100.42 Ratio derivative 25 25 50 25.44 101.76 15 35 70 15.14 100.98 Mean ± SD% 100.87±0.655 45 5 10 % 45.03 100.07 35 15 30 % 34.88 99.67 Ratio difference 25 25 50 % 25.13 100.52 10 40 80 % 10.05 100.58 Mean ± SD% 100.21±0.423 45 5 10 45.73 101.62 35 15 30 34.68 99.09 Mean centering 25 25 50 24.59 98.39 15 40 70 14.99 99.99 Mean ± SD% 99.77±1.399 Analytical Analytical CHEMISTRY Analytical Analytical CHEMISTRY An Indian Journal
ACAIJ, 16(6) 2016 Ahmed H.Abdel-monem et al. 273 Full Paper Full Paper µg ml-1. The corresponding regression equation was computed to be: P 251-233 = 0.0205C + 0.0368…………(r2 = 0.9999) Where P is the amplitude difference at the selected wavelengths (251 & 233), C is the concentration in g ml-1 and r2 is the correlation coefficient as shown in TABLE 1. VALIDATION OF THE METHODS Linearity and rang Area under the curve method Under the described experimental conditions, the calibration graph for the method was constructed by plotting area under curve versus concentration of cefadroxil in µg ml-1. The regression plot was found to be linear over the range of 5-50 µg ml-1. The linear regression equation for the graph is: PAUC = 0.1463 C + 0.2555 …………(r2 = 0.9999) Where PAUC is area under curve at the selected wavelength, C is the concentration of cefadroxil in µg ml-1 and r2 is the correlation coefficient, as shown in TABLE 1. The graphical absorption ratio (Q-Analysis) method Linear correlation was obtained between the absorbance at 275.2 nm, versus concentration of cefadroxil in µg ml-1 Good linearity is obtained in the concentration range of 5 - 50 µg ml-1. The linear regression equation for the graph is: A= 0.0115 C + 0.0245…………….(r2 = 0.9998) Where A is the bsorbance at the selected wavelength, C is the concentration of cefadroxil in g ml-1 and r2 = the correlation coefficient as shown in TABLE 1. Ratio derivative method Linear correlation was obtained between the absorbance values at 234 nm, against the corresponding concentration of cefadroxil Good linearity is obtained in the concentration range of (5 - 50 µg ml-1). The corresponding regression equation was computed to be: Mean centering method Linear correlation was obtained between the mean centered values at 243 nm, against the corresponding concentration of cefadroxil. Good linearity is obtained in the concentration range of (5 - 50 µg ml-1). The corresponding regression equation was computed to be: MCN 243 = 0.068 C + 0.0897………………….(r2 = 0.9998) Where MCN is the peak amplitude of the mean centered ratio spectrum curve at 243 nm, C is the concentration of cefadroxil in g ml-1 and r2 is the correlation coefficient, as shown in TABLE 1. Limits of detection and quantitation The limit of detection (LOD) and the limit of quantitation (LOQ) were calculated according to ICH guidelines[27] from the following equations: LOD = 3.3 Sa / slope LOQ = 10 Sa / slope Where Sa is the standard deviation of y-intercepts of regression lines. LOD and LOQ values of cefadroxil for each method were listed in TABLE 1. Accuracy and precision According to the ICH guidelines[24], three replicate determinations of three different concentrations of the studied drugs in pure form within their linearity ranges were performed in the same day (intra-day) and in three successive days (inter-day) for each method. Accuracy as recovery percent (R%) and precision as percentage relative standard deviation (RSD%) were calculated and results are listed in TABLE 2. Specificity The specificity of the proposed methods were assured by applying the laboratory prepared mixtures of the studied drug and its degradate. The results are A= 0.0034 C - 0.0045………………(r2 = 0.9997) Where A is the absorbance at the selected wavelength, C is the concentration of cefadroxil in g ml-1 and r2 = the correlation coefficient as shown in TABLE 1. Ratio difference method Linear correlation was obtained between the differences in amplitudes at 251 and 233 nm, against the corresponding concentration of cefadroxil Good linearity is obtained in the concentration range of 5 - 50 Analytical Analytical CHEMISTRY Analytical Analytical CHEMISTRY An Indian Journal
Quantitative analysis of cefadroxil in presence of its degradation product . 274 ACAIJ, 16(6) 2016 Full Paper Full Paper TABLE 4 : Determination of Cefadroxil in Duricef ® 500 Mg capsule by the proposed and reported methods Ratio derivative Ratio difference Mean centering Reported method[7] AUC QA N* 5 5 5 5 5 5 X 99.65 100.45 98.99 100.22 99.88 99.83 SD 1.502 0.861 1.326 1.162 0.783 1.490 RSD% 1.507 0.857 1.340 1.160 0.784 1.493 0.1827 (2.3060) 0.8063 (2.4469) 0.0709 (2.4469) t** 0.9386 (2.3060) 0.4630 (2.3060) —— F** 1.0162 (6.388) 2.991 (6.388) 1.2622 (6.388) 1.6434 (6.388) 3.616 (6.388) —— * No. of experimental.; ** The values in the parenthesis are tabulated values of t and F at (p= 0.05) listed in TABLE 3. Pharmaceutical applications The proposed methods were applied to the determination of the studied drug in (Duricef® 500) capsule The results were validated by comparison to a previously reported method[7]. No significant differences were found by applying t-test and F-test at 95% confidence level[12],indicating good accuracy and precision of the proposed methods for the analysis of the studied drugs in their pharmaceutical dosage form (TABLE 5). Spectrophotometric determination of cefadroxil using its charge-transfer reaction. Fenxi Huaxue, 26, 312-313 (1998). [4] Y.R.Mohan, P.V.Raju, A.B.Avadhanulu; Spectrophotometric estimation of cefadroxil monohydrate in its pharmaceutical dosage forms. Indian Drugs, 37, 233-235 (2000). [5] J.Makchit, S.Upalee, C.Thongpoon et al.; Determination of cefadroxil by sequential injection with spectrophotometric detector. Anal.Sci., 22, 591-597 (2006). [6] M.A.Korany, M.A.Elsayed, S.M.Galal; Use of Second Derivative Spectrophotometry For the Determination of Certain Cephalosporins and Their Acid- Induced Degradation Products In Combination. Analytical Letters, 22, 159-175 (1989). [7] M.A.Korany, M.A.Elsayed, S.M.Galal; Utility of Derivative Spectrophotometry For the Determination of Certain Cephalosporins and Their Alkali-Induced Degradation Products In Combination. Analytical Letters., 22, 141-157 (1989). [8] G.A.Saleh, H.F.Askal, I.A.Darwish et al.; Spectroscopic analytical study for the charge- transfer complexation of certain cephalosporins with chloranilic acid. Anal.Sci., 19, 281-287 (2003). [9] L.I.Bebawy, K.Kelani, L.A.Fattah; Stability- indicating method for the determination of some cephalosporins in the presence of degradation products. Spectrosc.Lett., 30, 332-343 (1997). [10] J.Yang, G.Zhou, G.Zhang et al.; Determination of some cephalosporins in pharmaceutical CONCLUSION The proposed methods are simple, rapid, accurate and precise and can be used for the determination of Cefadroxil in pure form and in pharmaceutical dosage form as well as in presence of its degradation product. REFERENCES [1] S.Sweetman; Martindale: the complete drug reference. 36th ed. London: The Pharmaceutical Press, (2009). [2] RxList: the internet drug index [Internet]. California: WebMD; 2004. duricef: drug description; [reviewed 2008 Apr 1; cited 2014 Dec 15]. Available from: http://www.rxlist.com/duricef-drug/indications- dosage.htm, (2014). [3] X.Chen, W.Dong, Z.Lang et al.; Analytical Analytical CHEMISTRY Analytical Analytical CHEMISTRY An Indian Journal
ACAIJ, 16(6) 2016 Ahmed H.Abdel-monem et al. 275 Full Paper Full Paper [20] V.M.Shinde, C.V.Shabadi; Simultaneous determination of cefadroxil and cephalexin from capsules by reverse phase HPLC. Indian Drugs; 34, 399-402 (1997). [21] M.M.Abdelrahman; Simultaneous determination of Cinnarizine and Domperidone by area under curve and dual wavelength spectrophotometric methods. Spectrochimica Acta Part A: Molecular and Biomolecular Spectroscopy, 113, 291–296 (2013). [22] N.S.Abdelwahab; Spectrophotometric methods for simultaneous determination of Carvedilol and Hydrochlorothiazide in combined dosage form. Arabian Journal of Chemistry, (2011). [23] K.Bhusari, P.B.Khedekar, S.Dhole, V.S.Banode; Derivative and Q-analysis spectrophotometric methods for estimation of hydrochlorothiazide and olmesartan medoxomil in tablets. Indian journal of pharmaceutical sciences, 71(5), 505–508 (2009). [24] F.Salinas, J.Nevado, A.Mansilla; A new spectrophotometric method for quantitative multicomponent analysis resolution of mixtures of salicylic and salicyluric acids. Talanta, 37(3), 347- 351 (1990). [25] E.S.Elzanfaly, A.S.Saad, A.B.Abd-Elaleem; Simultaneous determination of retinoic acid and hydroquinone in skin ointment using spectrophotometric technique (ratio difference method). Saudi Pharmaceutical Journal, 20, 249– 253 (2012). [26] H.W.Darwish, S.A.Hassan, M.Y.Salem, B.A.El- Zeiny; Three different spectrophotometric methods manipulating ratio spectra for determination of binary mixture of amlodipine and atorvastatin. Spectrochimica Acta Part A, 83(1), 140–148 (2011). [27] ICH Guideline Q2(R1) on Validation of Analytical Procedures: Text and Methodology, International Conference on Harmonization,Geneva, 6 Nov 1996, incorp. Nov, (2005). formulations by a fluorescence quenching method. Anal.Commun., 33, 167-169 (1996). [11] J.Yang, G.Zhou, X.Cao et al.; Study on the fluorescence characteristics of alkaline degradation of cefadroxil, cephradine, cefotaximum sodium and amoxicillini. Anal.Lett., 31, 1047-1060 (1998). [12] A.F.M.El Walily, A.Abdel-Kader Gazy, S.F.Belal et al.; Selective spectrofluorimetric determination of phenolic â-lactam antibiotics through the formation of their coumarin derivatives. J.Pharm. Biomed.Anal., 20, 643-653 (1999). [13] M.Hefnawy, Y.El-Shabrawy, Spectrofluorometric determination of alpha aminocephalosporins in biological fluids and pharmaceutical preparations. J.Pharm.Biomed. Anal., 21, 703-707 (1999). [14] S.A.Özkan, N. Erk, B.Uslu et al.; Study on electro- oxidation of cefadroxil monohydrate and its determination by differential pulse voltammetry. J.Pharm.Biomed.Anal., 23, 263-273 (2000). [15] M.V.Dhoka, S.S.Chopade; Method Development & Comparative Statistical Evaluation of HPLC & HPTLC Method for Simultaneous Estimation of Cefodrixil Monohydrate Hydrochloride. Indo Global Journal of Pharmaceutical Sciences, 2(2), 203-212 (2012). [16] P.U.Tompe, N.V.Shinde, A.R.Madgulkar; Development and Validation of Bioanalytical method for the determination of Ambroxol Hydrochloride and Cefadroxil in Human Plasma. International Journal of Research in Pharmaceutical and Biomedical Sciences, 4(4), 1239-1248 (2013). [17] C.Hendrix, Y.Zhu, C.Wijsen et al.; Comparative study of liquid chromatographic methods for the determination of cefadroxil. J.Chromatogr, 634, 257-261 (1993). [18] Z.Zhefeng, M.Jinxiu, L.Wei et al.; RP-HPLC determination of cefadroxil and its relative substances. Chin.J.Antibiot, 19, 289-292 (1994). [19] M.C.Nahata, D.S.Jackson; Liquid chromatographic method for the determination of cefadroxil in its suspension and in serum. J. Liquid Chromatog, 13, 1651-1656 (1990). F.Belal; & Ambroxol M.C.Damle, Analytical Analytical CHEMISTRY Analytical Analytical CHEMISTRY An Indian Journal