Download

1 / 9
90 likes | 108 Vues
Explore the latest data on Ebola Virus and Measles disease distribution in Democratic Republic of Congo, Uganda, and EU/EEA countries as of September 2019. Visualize confirmed cases through maps and graphs. Reusable and translatable content.

E N D
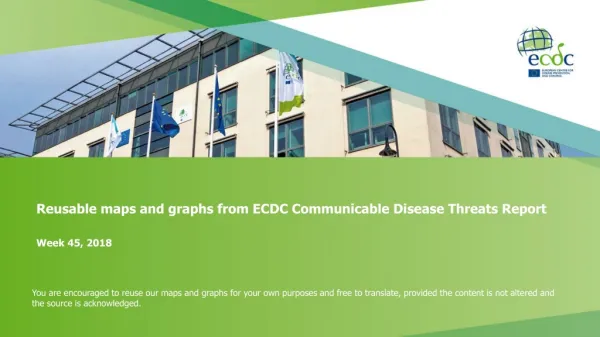
Reusable maps and graphs from ECDC Communicable Disease Threats ReportWeek 36, 2019 You are encouraged to reuse our maps and graphs for your own purposes and free to translate, provided the content is not altered and the source is acknowledged.
Distribution of confirmed and probable cases of Ebola virus disease by week of reporting, Democratic Republic of the Congo and Uganda, as of 11 September 2019
Ebola Virus Disease case distribution in DRC and Uganda as of 11September 2019
Geographical distribution of confirmed and probable cases of Ebola virus disease, Democratic Republic of the Congo and Uganda as of 11 September 2019
Distribution of West Nile virus infections in humans by affected areas in the EU/EEA Member States and EU neighbouring countries
Distribution of measles cases reported by EU/EEA, January 2017-July 2019
Distribution of measles cases reported by EU/EEA countries to TESSy by month and annual cumulative cases, January 2017- July 2019
Distribution of measles cases in selected EU countries with ongoing outbreaks, TESSy and epidemic intelligence data, January 2017-July (August) 2019