Download

1 / 4
40 likes | 122 Vues
Learn how to diagnose favorable conditions for deep convection using WV images. Discover the importance of pre-convective environment, instability index, and motion field in forecasting thunderstorms.

E N D
WV images to diagnose the context favourable for deep convection Patrick Santurette Forecast Laboratory METEO-FRANCE Christo Georgiev National Institute of Meteorology and Hydrology, Bulgarian
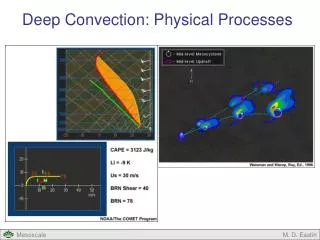
11 UTC 13 UTC IR, 925 hPa wind, θ’w 850 hPa, 12 UTC About pre-convective environment and WV information • WV Imagery information • 6.2 m imagery is (almost the only) information about upper-level • 7.3 m gives information about low- to mid-level • Potential instability pronounced when upper-levels cold and dry whilst low-levels moist and warm, so potential instability when: • warm brightness temperature on 6.2 m and • cold brightness temperature on 7.3 m • So making the difference 6.2 BT – 7.3 BT can provide an instability index > WV BT difference (WVBTDiff = 6.2 m BT – 7.3 m BT); dark blue for BT difference -18 to -10 dg C, light blue -10 to -5, green -5 to 0, yellow for > 0 dg. If WVBTDiff < -18 dg, grey when 6.2 BT >= -39 dg, light grey when 6.2 >, = -39 dg AND 7.3 <, = -19dg. Convection develops after 12 UTC from Greece to Bulgaria inside the light grey area. But pre-convective environment is NOT ONLY potential INSTABILITY • Necessity to add information about the motion field • as regards to the low-level forcing on ascending motion • …
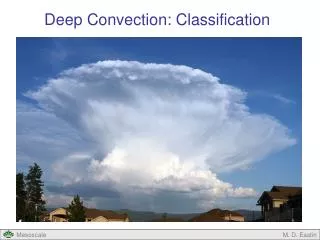
Z,T 500 hPa 24 Sep 2006 12 UTC Hail near Toulouse, highway temporarily closed EX 1 : Strong thunderstorms with hail, southwest of France, due to destabilisation by upper-level PV advection (1) Upper-level dry and cold air overhanging warm moist air at low level Convection development Infrared Image (colour), WV_6.2 µm (BT>= -39°C, grey shade), lightening
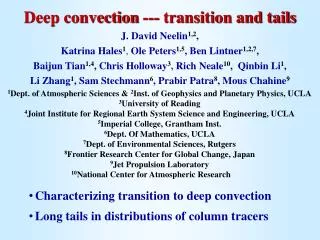
Radar 15 UTC 1100 UTC 1200 UTC EX 1 : Strong thunderstorms with hail, southwest of France, due to destabilisation by upper-level PV advection (2) WV 6.2 m = observation of upper-level moisture flow and upper-level dynamics (PV anomalies) WV 7.3 µm = observation of low- to mid-level moisture flow 6.2 – 7.3µm, 10 m MOCON analysis >necessity to add information: WV 6.2 µm Image WV 7.3 µm, BT < - 19°C Low-level convergence (LLConv) for example is a crucial parameter Strong convection is NOT ONLY potential INSTABILITY, motion field is crucial • Necessity to add information • as regards to the low-level forcing on ascending motion - Superimp. of LLConv on WVBTDiff can help as precursor of convective development • as regards to upper-level divergence, • as regard to ground parameters evolution? • …