Download
1 / 57
590 likes | 849 Vues
Vessel Recognition in Color Doppler Ultrasound Imaging. Ashraf A Saad 1 Electrical Engineering Department, University of Washington 2 Philips Healthcare, Ultrasound Division. Outline of the Work. Introduction The Shape Decomposition Approach Fringeline Tracking for Phase Unwrapping

E N D
Vessel Recognition in Color Doppler Ultrasound Imaging Ashraf A Saad1Electrical Engineering Department, University of Washington2Philips Healthcare, Ultrasound Division
Outline of the Work Introduction The Shape Decomposition Approach Fringeline Tracking for Phase Unwrapping Vessel Feature Generation and Selection Vessel Classification
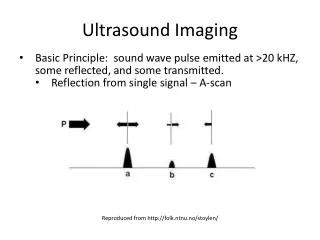
Introduction • In the last few decades, ultrasound imaging systems • have improved dramatically by offering high quality • images. • So far, ultrasound systems use very little knowledge • of the content of images they acquire to optimize • the acquisition and visualization processes of the images. • The main consequence of this fact is that machine • manipulation is still a tedious and time consuming task • with too many controls to adjust. • The goal of the work is to apply image analysis techniques • to automate one aspect of the problem: segmenting blood • vessels in ultrasound color Doppler images using high- • level shape information.
Philips iU22 Ultrasound System This system was used as a prototype platform for the research.
Screen Capture of an Ultrasound System • The gray scale ultrasound image (top half) depicts the anatomy of body organs. • The color Doppler image, overlaid on top of the grayscale image, depicts the blood flow velocity within blood vessels (the Carotid artery in this picture) • The spectral Doppler scrolling image (bottom) depicts the variation of blood flow velocities with time (showing systole and diastole phases here) The user manipulates the graphical components to optimize the image.
Goal and Steps Goal: Given a number of color Doppler ultrasound frames that contain one or more vessels, recognize all the specific vessels that exist in those images.
Shape Decomposition Approach • Obtain a representation of the vessel that is suitable • for extracting discriminative features • Uses color Doppler ultrasound images that span • one heart cycle • The consecutive set of frames used is called a • cineloop. • The format of the color Doppler image is signed 8-bit • pixels that form a color-coded representation • of the directional mean velocity of each pixel. • 30 frames per data set were captured.
Color Bleeding Artifact jugular vein carotid artery • Color bleeding artifact causes two or more distinct vessels • to appear as if they are connected in certain points • across their border. • This is a primary source of difficulty in vessel • segmentation.
Vessel Segmentation Approaches in the Literature • Multi-Scale (multiple resolutions) • Skeleton-Based • Ridge-Based (treating grayscale images as • elevation maps) • Region-Growing • Differential Geometry (models images as • hyper surfaces and extracts features using • curvature and crest lines) • Matching Filters (convolves images with • multiple filters) • Mathematical Morphology • Tracking • AI and Model-Based
Multiple Resolutions: Image Pyramids And so on. 3rd level is derived from the 2nd level according to the same funtion 2nd level is derived from the original image according to some function Bottom level is the original image.
Example: Mean Pyramid And so on. At 3rd level, each pixel is the mean of 4 pixels in the 2nd level. At 2nd level, each pixel is the mean of 4 pixels in the original image. mean Bottom level is the original image.
The skeleton or medial axis of a 2D shape is a set of points that are the centers of the set of maximal enclosed circles. Vessels should have fairly long straight axes.
When a grayscale image is treated as an elevation map, the ridges are the lightest areas and the valleys the darkest areas.
Region growing starts with a small region of an object to be detected, calculates its properties, and then performs statistical tests to decide whether or not to add adjacent pixels to “grow” the region.
Mathematical morphology tries to fit structuring elements of different shapes and angles into the white areas of a binary thresholding of a graytone image.
Shape Decomposition for Segmentation image representing a cineloop obtained as an average of all frames containing 4 vessels thresholded binary image with red lines representing the correct segmentation
Segmentation Algorithm Concepts Def: A part-line is a line whose end points lie on the object boundary and is entirely embedded in the object as a separator of parts. • Correct part-lines involve one (single-point part-line) or • two (double-point part-line) negative curvature minima. • Some negative curvature minima are due to noise • Distinct vessel segments are mainly convex and elongated. • When two adjacent parallel vessels are linked, the • eccentricity of the resulting linked object will be less than • that of at least one of the two original objects.
negative double-point curvature part-lines minima enclosing filtered circle of a double-point part-line part-lines not within object two first partition single-point with best part-lines part-line that associated results in a with a maximum concave point eccentricity part
filtered lists two new parts of points & with associated part-lines points and double-point part-lines a part with two new parts double-pnt from lower one part-line object partition final object after partition consuming all double- point part-lines
Vessel Segmentation Clinical Application - Automatic Doppler Angle Determination • Ultrasound systems offer a graphical user interface that • the user can move anywhere over the image to locate • the line center over the vessel’s site of interest. • The user can rotate a knob to align the line with • the vessel axis. • The ultrasound system software internally uses the position provided by the user to acquire Doppler spectrum signals while it uses the angle to calculate the blood flow velocity.
The two main drawbacks of the manual technique are • time consumed • angle inaccuracy • The new vessel segmentation results allows accurate • automation of the Doppler angle computation using the • skeletonization of the segmented vessels. • The Doppler angle is estimated as the best line fit of • the skeleton pixels around the Doppler gate*. *The Doppler gate is the point of interest inside a blood vessel that the user specifies to acquire the Doppler data from.
Doppler Angle Automation Results • The green square represents the Doppler gate position. • The white line represents the automated Doppler angle.
Bland-Altman Analysis • Bland-Altman analysis is a popular method in medical • statistics for evaluating the agreement between two • measurements. • It plots the difference of the two methods against the • mean of the two. If the differences are small, the • methods agree.
Doppler Angle Automation Statistical Validation – Matlab Simulations • Validating the angle automation against the gold standard: expert manual angle settings • Offline ultrasound color Doppler images were produced by expert sonographers from Philips Ultrasound. • Matlab GUI application was developed to allow manual expert angle estimation. • Automated angle estimation was calculated for the same manual Doppler gate positions. • Statistical regression and Bland-Altman analysis were conducted, showing strong correlation between manual and automated angle settings. • Correlation coefficient = 0.97 • Angle differences mean = -0.93˚ • Angle differences standard deviation = 5.4 ˚
Doppler Angle Automation Statistical Validation – Real-time Prototype • The vessel segmentation and Doppler angle automation applications were prototyped on the Philips iU22 ultrasound system using C++ code. • Expert sonographers conducted manual Doppler angle settings on model volunteers. • Automated Doppler angle was triggered using a system button after the manual setting. • Statistical regression and Bland-Altman analysis were conducted, showing strong correlation between manual and automated angle settings: • Correlation coefficient = 0.99 • Angle differences mean = 1.66˚ • Angle differences standard deviation = 6.44 ˚
Unaliased velocity Aliased velocity Color Doppler Aliasing Artifact and Phase Unwrapping Techniques • Color Doppler ultrasound is a powerful non-invasive blood vessel diagnostic tool, but it is still mainly a qualitative tool. • Components of the signal's spectrum with frequencies greater than twice its frequency will appear to lie at different places on the spectrum than they actually are. • This aliasing artifact is the main source of distortion of color Doppler images and occurs when the pulse repetition frequency (PRF) is not high enough to sample the highest blood velocity. • Our research goal is to recover the true velocities from the aliased ones in order to facilitate advanced quantification and image analysis tasks. • The color Doppler image is treated as a phase map, and the unaliasing problem is formulated as a phase unwrapping problem. An aliased color Doppler image of a flow phantom
Fringeline Tracking for Phase Unwrapping • Velocity aliasing is a common artifact in color • Doppler ultrasound imaging • The aliasing artifact occurs when the sampling • frequency used to acquire images is not high • enough to unambiguously sample the highest • blood flow velocity within the imaged vessels. • The artifact manifests itself as high velocity pixels • that appear to have reverse flow velocities.
Phase Unwrapping Theory The wrapping process is a nonlinear process. • Wrapped phase • within interval (-π, π] • Mapping • operator • True • phase • Integer • function The unwrapped phase can be calculated recursively by integrating the wrapped phase differences. • Gradient • operator Under the condition of phase continuity.
Relationship between True Phase and Wrapped Phase discontinuity
Phase Unwrapping Theory – cont. The phase continuity condition can be violated due to undersampling, noise, or nonlinear signal processing. • sum phase around each 2x2 square • if sum = 0, no discontinuity • if sum = 2, positive residue (+) • if sum = -2, negative residue (o) Traces of phase discontinuity can be easily detected. Discontinuities were flagged with non-zero value phase integrals. Phase discontinuity points are called “Residues”. Phase discontinuity residues Ignoring phase residues during unwrapping will cause unwrapping errors to propagate. Phase unwrapping errors
Tests of Existing Algorithms: Data Acquisition Protocol • Captured color Doppler cineloops that encompass at least one heart cycle. • Both flow phantom simulated waveforms and in-vivo peripheral vascular cases were captured. • Some acquisition controls had to be fixed to minimize distortion: • Temporal averaging “color persistence” is turned off. • Clutter filter is set to minimum setting. • Spatial smoothing is set to minimum setting. • The color scale or PRF is swept from very high settings to very low settings to generate unaliased, moderately-aliased, and severely-aliased cases. Flow phantom femoral dataset In-vivo carotid dataset
Tests of Existing Algorithms: Performance with Color Doppler Ultrasound Images Aliased frames Unwrapped frames Goldstein’s branch-cut introduced wrong residue connections. Flynn’s mask-cut algorithm’s quality maps did not always agree with the correct residue dipole connections. Flynn’s min. discontinuity algorithm performed the best. However unwrapping errors occurred and the algorithm is slow. Unwrapping errors are more severe with minimum normalization methods, including DCT and PCG algorithms. The existing algorithms achieve consistent, but not necessarily accurate results.
The New Fringeline-Tracking Approach Recently, some algorithms sought accurate phase unwrapping results for MRI based on the detection of true phase discontinuitycutlines. Cutlines are borderlines between adjacent pixels where the modulus of the true phase variation gets larger than π. Fringelines are borderlines between two adjacent pixels where phase wrapping occurs (±2π jumps). Residues are the intersection points between cutlines and fringelines. • Cutlines Introducing phase shift to the image causes the fringelines to shift, but the cutlines will not shift. Proposed methods find portions of the hidden cutlines as the union of many intersecting phase shifted fringelines, or the ridges of the superpositioned phase shifted fringelines. • Fringelines
Unwrapped pixels Severely-wrapped pixels Moderately-wrapped pixels The New Fringeline-Tracking Approach – cont. • The clinically useful range for color Doppler phase unwrapping is (- 3π, 3π]. • The pixels can be classified as: unaliased, moderately-aliased, and severely-aliased. • Phase discontinuity occurs between unaliased and severely-aliased regions. • Nearby the phase discontinuity regions, the unwrapped pixels tend to cluster around π, while the severely-wrapped pixels tend to cluster around 0. • The logical threshold that can separate the two clustered regions is the fringeline associated with the π/2 (or - π/2) phase shift. • The π/2 (or - π/2) fringelines guide the coupling of the opposite-sign residues. • Heuristic information is used to select one of the two unwrapping solutions.
The New Fringeline-Tracking Unwrapping Results Aliased frames Unwrapped frames
Results Validation • Qualitative validation based on heuristic information about the underlying vessel: • Pulsatility: heart pulsation • Phasicity: related to heart cycle • Flow direction: toward or away from ultrasound transducer • PRF and peak velocity: max velocity of the blood within the vessel If successful, the pulsatility, phasicity and direction should be maintained. Quantitative validation based on the maximum velocity estimation from the unwrapped cineloops. The estimated max velocity should match across the sweeping PRF (Pulse Repetition Frequency).
Results Statistical Analysis Phase unwrapping success rates for all algorithms
Phase Unwrapping Conclusions • The color Doppler aliasing problem was addressed and a new phase unwrapping technique was developed. • The results should open the door for more advanced quantification and image analysis applications. • The phase unwrapping results constitute a building block of a vessel recognition system based on the analysis of color Doppler ultrasound images.
Vessel Feature Generation • After the preprocessing steps of the recognition system • (vessel segmentation and phase unwrapping), the next task • is the vessel feature extraction. • Generation of input data for the recognition system involved: • Histogram-based data reduction methodology • Data preprocessing to achieve invariance under several transformations • Transform-based feature extraction methods
Data Acquisition Protocol • In order to run controlled experiments, a Doppler • flow phantom was used for the data acquisition. • Five different waveforms typically found in human • vessels were used as a case study: • carotid • constant • femoral • sinusoidal • square
carotid constant femoral sinusoidal square
Processing • First phase unwrapping was applied • Next dimensionality reduction was performed • on the unwrapped color Doppler data, while • maintaining the temporal signature of the • underlying vessel. • This signature can be used directly or through • transformations by the recognition system • without attempting to extract additional • discrete features.
Color Doppler Virtual Spectrogram Discretized Velocity Frame Number