Download
1 / 21
280 likes | 385 Vues
Learn about ultrasound waves, sound propagation, imaging systems, pulse generation, and data collection in the field of medical ultrasound. Explore A-Mode and M-Mode scanning for tissue characterization and diagnostic imaging.

E N D
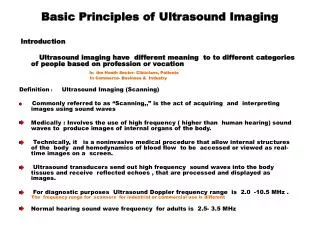
Ultrasound Imaging Atam Dhawan
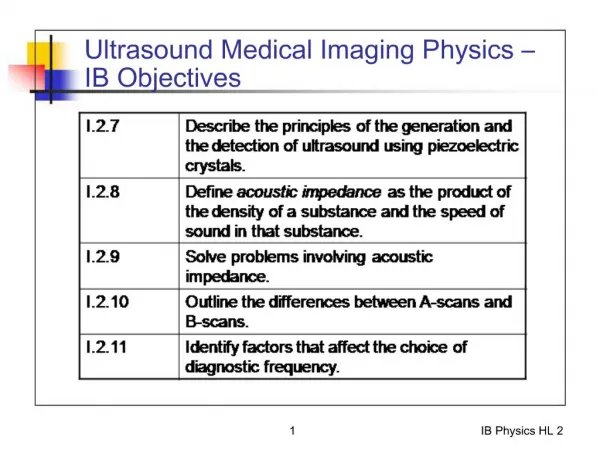
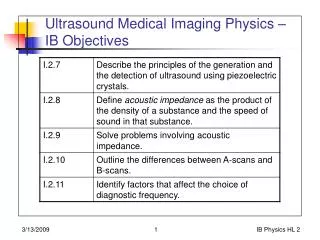
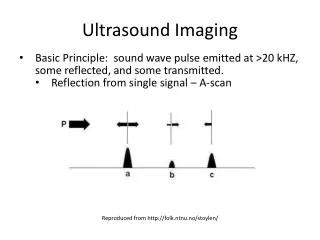
Ultrasound • Sound waves above 20 KHz are usually called as ultrasound waves. • Sound waves propagate mechanical energy causing periodic vibration of particles in a continuous, elastic medium. • Sound waves cannot propagate in a vacuum since there are no particles of matter in the vacuum. • Sound is propagated through a mechanical movement of a particle through compression and rarefaction that is propagated through the neighbor particles depending on the density and elasticity of the material in the medium. • The velocity of the sound in • Air: 331 m/sec; Water: 1430 m/sec • Soft tissue: 1540 m/sec; Fat: 1450 m/sec • Ultrasound medical imaging: 2MHz to 10 MHz • 2 MHz to 5 MHz frequencies are more common. • 5 MHz ultrasound beam has a wavelength of 0.308 mm in soft tissue with a velocity of 1540 m/sec.
Sound Propagation The attenuation coefficients and propagation speeds of sound waves.
Sound Velocity • The velocity of a sound wave in a medium, c, is related to its wavelength l and frequency n by c=ln
The Wave Equation If a small force dF is applied to produce a displacement of u+du in the x-position on the right-hand side of the small volume. A gradient of force is thus generated across the element. where r is the density of the medium and is the compressibility of the medium.
Acoustic Impedance where k is the wavenumber and equal to 2p/lwith wavelength l. The pressure wave that results from the displacement generated is given by The particle speed and the resulting pressure wave are related as where Z is the acoustic impedance defined as the ratio of the acoustic pressure wave at a point in the medium to the speed of the particle at the same point. Acoustic impedance Z is the characteristic of the medium as
Z4 Z3 Z5 Z2 Z1 I0 T2,1 T1,2 T2,3 T3,4 T5,4 T4,3 T3,2 R0 x1 x2 x3 Multilayered Propagation A path of a reflected sound wave in a multilayered structure.
Reflection and Transmission • Refection and Transmission with acoustic impedances Since 1+Rij = Tij,,
t t t x x x x x x 0 0 x x x Group 3 Group 3 Group 3 Group 2 Group 2 Group 2 Group 1 Group 1 Group 1 Array of elements … … … … … … Beam wavefront Beam direction Transducer and Arrays
Pulse Generation and Timing Transmitter/ Receiver Circuit Control Circuit Acoustic absorbers Blockers Piezoelectric crystal Data-Acquisition Analog to Digital Converter Computer Imaging Storage and Processing Display Imaging Object Imaging System • A schematic diagram of a conventional ultrasound imaging system
Data Collection • Let us assume that a transducer provides an acoustic signal of s(x,y) intensity with a pulse that is transmitted in a medium with an attenuation coefficient, m and reflected by a biological tissue of reflectivity R(x,y,z) with a distance z from the transducer. The recorded reflected intensity of a time varying acoustic signal, Jr(t) over the region R can then be expressed as: and c, respectively, represent received pulse and the velocity of the acoustic signal in the medium.
Data Collection .. The compensated recorded reflected signal from the tissue, Jcr(t) can be simplified to
Ultrasound Imaging • An ultrasound transducer provides brief pulses of ultrasound when stimulated by a train of voltage spikes of 1-2 msec duration applied to the electrodes of the piezoelectric crystal element. • An ultrasound pulse • A few cycles long: 2-3 cycles. • As the same crystal element is used as the receiver, the time between two pulses is used for detecting the reflected signal or echo from the tissue.
A-Mode Scan • A-Mode scan: • Records the amplitude of returning echoes from the tissue boundaries with respect to time. In this mode of imaging the ultrasound pulses are sent in the imaging medium with a perpendicular incident angle. • Since the echo time represents the acoustic impedance of the medium and depth of the reflecting boundary of the tissue, distance measurements for the tissue structure and interfaces along the ultrasound beam can be computed. • The intensity and time measurements of echoes can provide useful three-dimensional tissue characterization.
M-Mode Scan • M-Mode Scan • Provides information about the variations in signal amplitude due to object motion. • A fixed position of the transducer, in a sweep cycle, provides a line of data that is acquired through A-mode. • The data is displayed as a series of dots or pixels with brightness level representing the intensity of the echoes. • In a series of sweep cycles, each sequential A-line data is positioned horizontally. • As the object moves, the changes in the brightness levels representing the deflection of corresponding pixels in the subsequent sequential lines indicate the movement of the tissue boundaries. • The x-axis represents the time while the y-axis indicates the distance of the echo from the transducer.
M-Mode Image M-Mode display of mitral valve leaflet of a beating heart
B-Mode Scan • B-Mode Scan • Provides two-dimensional images representing the changes in acoustic impedance of the tissue. • The brightness of the B-Mode image shows the strength of the echo from the tissue structure. • To obtain a 2-D image of the tissue structure, the transducer is pivoted at a point about an axis and is used to obtain a V-shape imaging region. Alternately, the transducer can be moved to scan the imaging region. • Several images of the acquired data based on the processing kernel filters can be displayed to show the acoustic characteristics of the tissue structure and its medium.
B-Mode Image The “B-Mode” image of a beating heart with mitral stenosis.
Doppler Image where v is the velocity of the moving source or object, f is the original frequency, c is the velocity of the sound in the medium, and is the incident angle of the moving object with respect to the propagation of the sound. A Doppler image of the mitral valve area of a beating heart.