Download
1 / 1
10 likes | 127 Vues
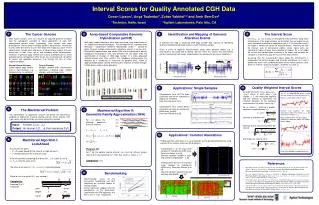
The study explores the identification and mapping of genomic alterations in cancer through array-based comparative genomic hybridization (aCGH). Most cancers arise from acquired genomic instability, leading to multiple abnormalities, including chromosomal gains and losses. This research focuses on utilizing interval scoring methods to detect significant deviations in DNA copy number, identifying amplified or deleted regions in tumor samples. By analyzing log(R/G) measurements, the importance of high-resolution techniques in understanding genomic alterations in various cancers is emphasized.

E N D
(j1) >0 (j2) <0 (j3) j kj The Cancer Genome Array-based Comparative Genomic Hybridization (aCGH) Identification and Mapping of GenomicAlteration Events 3 The Interval Score Most human cancers arise as a result of an acquired genomic instability and the subsequent evolution of clonal populations of cells with accumulated genetic errors. Accordingly, most cancers and some premalignant tissues contain multiple genomic abnormalities not present in cells within the normal tissues from which the neoplasias arose. These abnormalities include gains and losses of chromosomal regions that vary extensively in their sizes, up to and including whole chromosomes. Increases in genomic copy number can lead to overexpression of tumor promoter genes (oncogenes) while losses are associated with disruption of normal cell regulatory processes (e.g through the loss of tumor suppressor genes). Let C=(c1…cn) be a vector of all log(R/G) measurements along some chromosome. if the target contains an aberration then we expect to see many consecutive positive or negative entries in C. On the other hand, if the target is normal we expect no localized effects. Intuitively, we look for intervals (sets of consecutive probes) where signal sums are significantly higher or lower than expected at random. As a null model we assume that no aberration is present in the target, and therefore the variation in C represents only the noise of the measurement. Assuming that the measurement noise along the chromosome is independent for distinct probes and normally distributed, let µ and denote the mean and standard deviation of the normal genomic data. Given an interval I spanning k probes, we define its score as: DNA copy number alterations have been measured using fluorescence in situ hybridization-based techniques. The development of a genome wide technique – Comparative Genomic Hybridization (CGH) – allowed to jointly measure multiple chromosomal alterations present in cancer cells. Differentially labeled tumor and normal DNA are co-hybridized to normal metaphase chromosomes and ratios between the two labels allow the quantification of changes in DNA copy number. In a more advanced method termed array CGH (aCGH), the metaphase chromosomes are replaced by a microarray of thousands of genomic BAC, cDNA or oligonucleotide probes, greatly enhancing the resolution at which changes in DNA copy number may be detected. A common first step in analyzing DNA copy number data consists of identifying aberrant (amplified or deleted) regions in each individual sample. Given a series of log(R/G) measurements along some genomic region, e.g. a chromosome, we would like to identify intervals within this vectors that consistently contain significantly high values (amplifications) or significantly low values (deletions) Normal Human Genome Stable diploid copy number even in most diseases, e.g. cardiovascular, neurological. Cancer Genome Multiple genome-wide chromosome aberrations including copy number changes and rearrangements Deletion Amplification 0.5 0.5 Quality Weighted Interval Scores Applications: Single Samples 0 0 -0.5 -0.5 Consider the vector V=((c1,q1),(c2,q2),…(cn,qn)) where at each locus i the number ci is the measured log(R/G) and the number qi represents the standard deviation of this particular measurement. For every I set wi=(qi)-2. Chr. 17 of MDA-MB-453 breast cancer cell-line sample Data from Barrett et al [1]. Analysis using simple interval score: Chromosome 16 of HCT116 colon carcinoma cell line on high-density oligo array (n=5,464). Data from Barrett et al [1]. 1 HT-29 colon carcinoma cell line [1] A2BP1 FRA16B 0 Log2(ratio) -1 Chromosome 17 of several breast carcinoma cell lines on mid-density cDNA array (n=364). Data from Pollack et al [3]. For an interval I, spanning k probes, compute a weighted mean: Variance of individual loci: Variance due to consistency within the interval: And finally, the interval score: 0 25 50 75 Mbp 7 ERBB2 The MaxInterval Problem MaxInterval Algorithm II:Geometric Family Approximation (GFA) 1 Analysis that accounts the signal consistency within the interval (con) and single locus variance (loci). Note the difference in the aberrations called for the genomic regions 58-75Mbp, and 8-15Mbp. 0 For convenience of algorithmic analysis we define the MaxInterval problem of finding the maximal scoring interval. Other intervals with high scores may be found by recursively calling this function. 1 0 Log2(ratio) 1 For >0 define the following geometric family of intervals: 0 Input: A vector C=(c1…cn) Output: An interval I[1…n], that maximizes S(I) 1 0 0 25 50 75 Mbp Applications: Common Aberrations MaxInterval Algorithm I:LookAhead Finding common aberrations in a set of samples can be performed directly by using variants of the interval score (see [2] for details). Log2(R/G) • Assume you are given: • m – An upper bound for the value of a single element ci • t – A lower bound on the maximum score Chromosome 3 of 26 lung tumor samples on mid-density cDNA array. Data from Dehan et al [4]. Common deletion located in 3p21 and common amplification – in 3q. Theorem [2]: Let I* be the optimal scoringinterval. Let J be the leftmost longest interval of fully contained in I*. Then S(J) ≥ S(I*)/, where -2. Complexity:O(n) Radii of the datapoints proportional to wi I I’ Genomic position Genomic position If we are currently considering an interval I=[i,…,i+k-1] with a sum of s = jI cj, then the score of I is: The score of an interval I’ = [i,…,i+k+x-1] is then bounded by: Chromosomes 8 and 11 of 37 breast tumor samples on mid-density cDNA array. Data from Pollack et al [4]. Common deletion located in 8p and common amplification – in 11q. Samples sum s s+mx length k k+x 8 Benchmarking score Solve for first x for which S(I ) may exceed t. Benchmarking results of the Exhaustive, LookAhead and GFA algorithms on synthetic vectors of varying lengths. Linear regression suggests that the complexities of the Exhaustive, LookAhead and GFA algorithms are O(n2), O(n1.5), O(n), respectively. Complexity: Expected O(n1.5) (unproved) Samples Interval Scores for Quality Annotated CGH Data Doron Lipson1, Anya Tsalenko2, Zohar Yakhini1,2 and Amir Ben-Dor2 1Technion, Haifa, Israel 2Agilent Laboratories, Palo Alto, CA 1 2 4 9 11 5 10 6 References • Barrett MT, Scheffer A, Ben-Dor A, Sampas N, Lipson D, Kincaid R, Tsang P, Curry B, Baird K, Meltzer PS, Yakhini Z, Bruhn L, and Laderman S., Comparative Genomic Hybridization using Oligonucleotide Microarrays and Total Genomic DNA.PNAS 2004; 101(51):17765-70. • Lipson D, Aumann Y, Ben-Dor A, Linial N, and Yakhini Z., Efficient Calculation of Interval Scores for DNA Copy Number Data Analysis. Ninth Annual International Conference on Research in Computational Molecular Biology, RECOMB 2005 (Cambridge, MA). • Pollack JR, Sorlie T, Perou CM, Rees CA, Jeffrey SS, Lonning PE, Tibshirani R, Botstein D, Borresen-Dale AL, and Brown PO. Microarray Analysis Reveals a Major Direct Role of DNA Copy Number Alteration in the Transcriptional Program of Human Breast Tumors.PNAS 2002; 99(20): 12963-12968. • Dehan E, Ben-Dor A, Liao W, Lipson D, Rienstein S, Simansky D, Krupsky M, Yaron P, Friedman E, Rechavi G, Perlman M, Aviram-Goldring A, Bittner M, Yakhini Z, and Kaminski N. Chromosomal Aberrations and Gene Expression Profiles in Non Small Cell Lung Cancer. In preparation.