Predicting White Wine Quality Scores
60 likes | 197 Vues
This study explores the use of intuitive tree models for predicting white wine quality scores. Tree models require minimal statistical knowledge and can integrate with advanced algorithms to enhance prediction accuracy. A practical example demonstrates how alcohol content influences quality scores, while terminology is clarified with nodes and observation counts. The methodology includes bagging, where multiple bootstrap samples enhance prediction precision. Results indicate that the bagged tree model offers slightly better predictions, showcasing its effectiveness in wine quality assessment.

Predicting White Wine Quality Scores
E N D
Presentation Transcript
Predicting White Wine Quality Scores Raphael Mwangi
Background • Tree-models are intuitive, easy to understand, and can be used as tools for more advanced algorithms to create highly accurate models • Tree-modeling requires practically no knowledge of statistics to understand
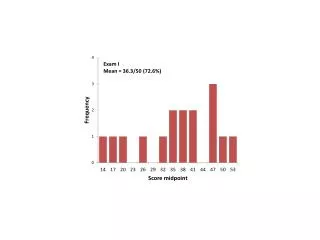
=3898 =5.87 Basic Example If Alcohol > 10.85 If Alcohol < 10.85 =1433 =6.345 =2465 =5.596 • Terminology: • “Node” – denoted ,a circle in which observations are grouped into by a particular If Then statement • “” = the number of observations in the node “” • = the average wine quality score of the N observations in the node “”.
Bagging • Bagging • Take a large number of samples, “B”, of size n from your dataset, with replacement (bootstrap samples) • Fit a tree model to each bootstrap sample. • When making predictions of y for specific values of x, average from your “B” bootstrap samples for a more accurate prediction
Results of Single Tree Model vs. Bagged Tree Model • Each prediction we make will, on average, be: • 0.77 points off from the true wine quality score for the Single Tree Model • 0.75 points off from the true wine quality score for the Bagged Tree Model • Bagged model did slightly better