Understanding Trade Liberalization Impacts on Wage Inequality
Explore wage disparity due to trade liberalization, impact on skilled/unskilled labor, and factors affecting attitudes towards trade policies. Analyze income distribution trends in China and Nigeria, South's influence on politics and wages. Examine Mexico's trade liberation effects on job sectors. Investigate education's role in job market and trade policy implications.

Understanding Trade Liberalization Impacts on Wage Inequality
E N D
Presentation Transcript
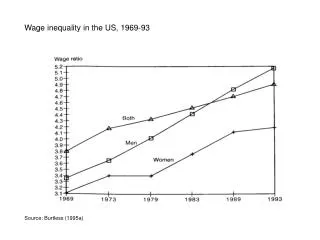
Wage inequality in the US, 1969-93 Source: Burtless (1995a)
Skilled/unskilled wage ratio, US, 1961-93 Sources: Sachs and Shatz (1995), Feenstra and Hanson (1995); Burtless (1995b)
The politics of trade liberalization in the North North: Abundant in skilled labor, poor in unskilled labor Trade opens Specializes in high-tech (e.g. machinery) Low-tech output contracts, high-tech output expands Excess supply of unskilled labor Median-voter unskilled: Opposed to trade liberalization Unskilled wage is depressed Unskilled wage does not adjust Both sectors become more intensive in unskilled labor Unemployment rises in the import-competing sector Full-employment is preserved
Determinants of attitudes toward trade liberalization: EU-Switzerland Results of Swiss referendum on bilateral accords Source: Anson Cadot 2004.
Determinants of attitudes toward trade liberalization: CUSFTA Results of Canadian exit poll Stolper-Samuelson? Who’s the « South »? Source: Beaulieu, 2002. Notes: age and constant omitted. Similar regression with sector of employment as regressors returns only insignificant coefficients.
Distribution of voters’ preferred policies Less than half the population Half the population (by def. of the median) Policy preferred by the median voter Policy preferred by the average voter The median-voter theorem Definition Suppose that policy can be represented by a single number (e.g. rate of a uniform tariff) and let p be the policy preferred by the median voter. Then half the electorate want a policy higher than p and half want a policy lower than p. Theorem If two policies, A and B, are subjected to a vote, and A is the policy preferred by the median voter, then A is sure to win whatever B.
Income distribution over time: China • Growing middle class: the median voter is a middle-class individual and has the preferences of the middle class: • Improved infrastructure • Good education • Law and order • Outcome: pro-growth • policies Data source: Sala i Martin 2002
Income distribution over time: Nigeria Shrinking middle class: the median voter is a poor individual and has the preferences of the poor: essentially income/wealth redistribution. Outcome: growth-retarding policies Data source: Sala i Martin 2002
South: Abundant in unskilled labor, poor in skilled labor Trade opens Specializes in low-tech (e.g. garments) Low-tech output expands, high-tech output contracts Excess demand for unskilled labor Unskilled wage rises Both sectors become less intensive in unskilled labor Full-employment is preserved The politics of trade liberalization in the South Median-voter unskilled: Favorable to trade liberalization
Mexico’s trade liberalization Source: Nicita 2004
Mexico’s trade liberalization: Effect on skilled and unskilled wages Source: Nicita 2004
Mexico’s trade liberalization What did Mexico liberalize? What did it protect in the first place? Source: Nicita 2004
What is an unskilled job? Probability of being hired as a garment worker in Madagascar as a function of worker characteristics (probit reg) Effect of education peaks at 11 years---more than the work-force average 11 years workforce average: 9 years Source: Nicita 2004
prob (pro free trade) prob (pro free trade) prob (pro free trade) case A γ > 0 γ education education education case B γ = 0 GDP per capita γ < 0 case C Trade policy and factor endowments (i) Unit of observation: individual (data from national surveys) Unit of observation: country (regression coefficient estimated on national survey) Source: Mayda and Rodrik, 2002.
Trade policy and factor endowments: empirical results from ISSP Source: Mayda and Rodrik 2002
Trade policy and factor endowments: empirical results from WVS Source: Mayda and Rodrik 2002
Figure 2.3 Tariffs, endowments, and inequality t k σ South Korea’s k Regression surface for t = 3.291 - 0.051 σ + 0.006 σk - 0.328k Source Table 1 of Dutt-Mittra (2002), tariff regression with controls


![[f´‚nE˘RIks]](https://cdn0.slideserve.com/1072532/f-ne-riks-dt.jpg)