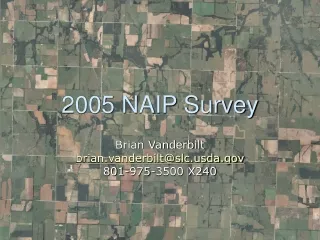
2005 NAIP Survey
2005 NAIP Survey. Brian Vanderbilt brian.vanderbilt@slc.usda.gov 801-975-3500 X240. Overview. Why do a Survey? Survey Process Survey Results. Why do a Survey?. Ask the Question “How did APFO do in providing useful NAIP imagery to it’s primary customer?” Quantitative

2005 NAIP Survey
E N D
Presentation Transcript
2005 NAIP Survey Brian Vanderbiltbrian.vanderbilt@slc.usda.gov801-975-3500 X240
Overview • Why do a Survey? • Survey Process • Survey Results
Why do a Survey? • Ask the Question “How did APFO do in providing usefulNAIP imagery to it’s primary customer?” • Quantitative • QQ Exposure Dates During Acquisition Period • Qualitative • County/State Survey Feedback • Goal • “Do better next year”
Survey Process • Developing the Survey • Scoring the Survey • Survey Results
Survey Process • Developing the Survey • Understand FSA programs • Ask questions to derive answers about • Usefulness of imagery • Timeliness of imagery • Make survey easy to take • Allow for textual comments • “I can’t tell the difference between corn and soybeans” • “Imagery delivered too late for compliance work” • “This imagery is great compared to 2004” • Allow for “N/A” or “Unsure” answers
Survey Process • Developing the Survey • Sent out email to State GIS Coordinators/Specialists • 2 Attachments • Memo from Director • Survey in excel • Requested Coordinators/Specialists to forward surveys to county service center reps and to take surveys themselves • Completed surveys to APFO via email by 15 Dec 05
Survey Process • Scoring the Survey • Coded to auto-populate excel score sheet for • Questions 1-10 • Based on FIPS • Questions 11-12 manually populated • Questions 13-14 considered, but not populated in the score sheet • Textual comments • “N/A” and “Unsure” answers not scored
Question by Question Breakdown Q1-Q8 Mean is out of possible 5 points. Q9-10 Mean is out of a possible 10 points.
Derived from the Raw Data of Counties in IA that have Taken the Survey, 2950 Points were Accrued out of a Possible 3480. 2950/3480 = 84.77% Overall Survey Scoring Average This Is Not An Eye Test
Survey Results - Iowa • Survey Comments • I am able to tell the difference between crops but I am not able to identify the crops without a certification map from the producer. • If our county had been flown earlier, it would have been much easier to determine oats from alfalfa or mixed hay. • The imagery from last year was much better. • It is very difficult to tell the difference this year between corn and beans. The colors are primarily in the gray tones with just a little difference in a touch of green. • Our imagery was taken August 6th. We would be better served if the date was 2 or 3 weeks earlier. • The color quality was a disappointment as it is hard to distinguish between crops.
Survey Results - Iowa • Survey Comments • It would be great if the system was faster when working with imagery. • The imagery for 2005 was not the best quality in our county; not a lot of contrast and color; kind of a gray-green. Last year there was differing colors of green and contrast between crops. • We have 2 major highways going through our County and the imagery has been really helpful with that. • It makes certification much easier. • The 2005 NAIP photos are not as clear as I would like to see. Details are not very clear when zoomed in close. • The 2005 NAIP imagery was much better than the 2004. • Our 2003 imagery was not usable due to poor quality. Our 2004 imagery was excellent. Our 2005 imagery is not as good of quality as the 2004, but much better than 2003. It lacks color quality making it difficult to determine crop types.
Question by Question Breakdown Q1-Q8 Mean is out of possible 5 points. Q9-10 Mean is out of a possible 10 points.
Derived from the Raw Data of Counties in OK that have Taken the Survey, 1562 Points were Accrued out of a Possible 2070. 1562/2070 = 75.46% Overall Survey Scoring Average This Is Not An Eye Test Either
Survey Results - Oklahoma • Survey Comments • The newer color photography makes and acreage report more accurate, because producers seem to orient themselves better using it rather than the old black and white photography. • The quality of the image is excellent, and I know that better imagery costs money, but when we can afford it let's buy the best quality we can afford. It would be better to get closer the surface of the earth without blurring. • The NAIP process is good, our problem is not technology but rather the lack of employees needed to utilize the technology. We have the NAIP imagery but have still not begun our 2005 compliance spot checks due to the CDP program, LAP program, NAP activity etc. and no extra help. • Having the imagery at 1 meter instead of 2 would help with clarity. • The quality of the 2005 NAIP was not as good as the previous year • Need flights flown earlier (mid May); Need the imagery in office timely.
Survey Results - Oklahoma • Survey Comments • Have the imagery taken on or very near to the dates that the county requests. If we could have the imagery available in the office earlier we could save a good number of trips to the filed. Determination could be made earlier along with compliance activities. • The 2005 NAIP was so bad that we were unable to use it for anything, much less for compliance purposes. • It would be helpful to have our county flown twice a year for compliance. • We are very satisfied with the timing and quality of the compliance imagery. Lower marks are due to the problems experienced with ArcMap Compliance software failure. • Better training material should be provided to the user. • I think late April or early May would be a good time to fly north central Oklahoma winter wheat counties, they may even be good in March? • I have been with the agency for 27 years in December, and this is the best improvement to any program area I have seen in that time. I love it.