Download
1 / 2
20 likes | 291 Vues
BULL & BEAR MARKETS. S&P/TSX INDEX to June 2003. 460. 300. 288% 81 months. 253% 61 months. 203% 90 months. 220. 140. 109% 24 mos. 82% 40 months. 81% 43 months. 85% 48 mos. 44% 25 mos. 63% 32 months. 100. % Change (log scale). 40. 16% 6 mos. 8% 9 mos. 0. -15%

E N D
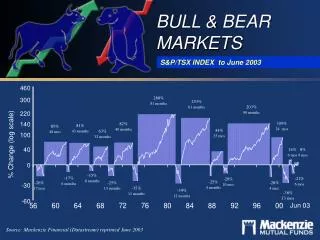
BULL & BEAR MARKETS S&P/TSX INDEX to June 2003 460 300 288% 81 months 253% 61 months 203% 90 months 220 140 109% 24 mos 82% 40 months 81% 43 months 85% 48 mos 44% 25 mos 63% 32 months 100 % Change (log scale) 40 16% 6 mos 8% 9 mos 0 -15% 8 months -17% 6 months -21% 6 mos -20% 10 mos -25% 4 months -30 -26% 17 mos -25% 13 months -28% 4 mos -35% 11 months -39% 12 months -38% 13 mos -60 Jun 03 Source: Mackenzie Financial (Datastream) reprinted June 2003
BULL & BEAR MARKETS S&P/TSX INDEX to June 2003 THE RISKS AND REWARDS OF INVESTING • This chart represents the bull and bear markets in the S&P/TSX since 1956. All bars above the line are bull markets; all bars below are bear markets. • For the purposes of this illustration, a bull (bear) market is defined as a positive (negative) move greater than 15% that lasts at least 3 months. • The first bar represents a bear market which, at its lowest point, dropped to -26% and lasted 17 months. This was followed by a bull market rising 85% and lasting 48 months. • Since 1956 there have been 10 bull markets and 11 bear markets. As can be seen from the chart, bull markets typically last longer and provide a more significant percentage change. • Bear markets during this period have averaged -26% and lasted only 10 months. Bull markets during this period have averaged 122% and lasted 45 months. This is the reward for accepting the risk of bear markets. • INVESTOR BEHAVIOUR • According to the chart, markets spend more time in positive territory (bull) than negative (bear). • Bull markets are, on average, longer and more intense, providing a more significant percentage change. • The bear markets are, on average, more brief, and yet engender fear. It is during these periods that we should be investing. • Investor discipline during the bear markets is critical.