Impact of GTPgS and Insulin on IR Phosphorylation and ADP-Ribosylation Dynamics
80 likes | 233 Vues
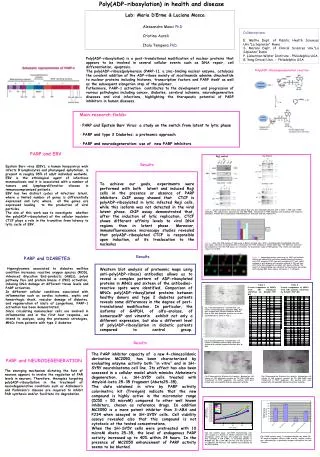
This study investigates the effects of GTPgS and insulin treatment on insulin receptor (IR) phosphorylation and ADP-ribosylation in various experimental conditions. Using densitometric analysis, we measured the fold increase in IR phosphorylation over baseline at different time points and concentrations of GTPgS. Additionally, we examined the interactions between IR and G-proteins, focusing on Gai2 and other regulatory proteins. The results highlight the intricate regulatory mechanisms governing insulin signaling pathways.

Impact of GTPgS and Insulin on IR Phosphorylation and ADP-Ribosylation Dynamics
E N D
Presentation Transcript
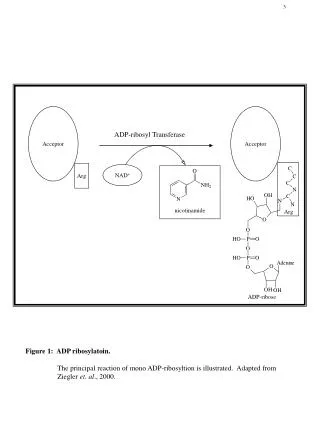
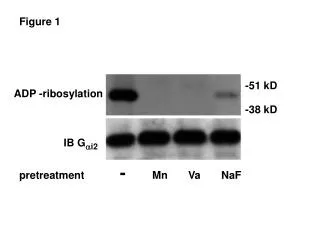
Figure 1 -51 kD ADP -ribosylation -38 kD IB Gai2 pretreatment - Mn Va NaF
-121 kD IRb -86 kD Figure 2 A B IB P-tyr IB P-tyr IRb time (min) 0 2 5 10 15 GTPgS (µM) 0 0.1 1 10 100 20 4 IR-phosphorylation densitometrie units IR-phosphorylation fold increase 10 2 0 0 0 0,1 1 10 100 0 2 5 10 15 GTPgS (µM) time (min)
. Figure 2 C D 50 4 Ins + 10 µM GTPgS Insulin + GTPgS Insulin Ins IR-phosphorylation fold increase IR- phosphorylation fold increase over baseline 2 25 0 0 0 1 10 100 0,1 insulin - - + + insulin (nM) GTPgS GTPgS - + - + - + + - E 150 100 IR- phosphorylatin % of maximum activity 50 0 0 1 10 100 GDPbS (µM)
Figure 3 A B pretreatment - ins M IR M IR M IR IB IRß IB IRb stimulation - ins - ins IB Gai IB Gai2 Gai1 Gai2 Gai3 IB Gb2 IB Gaq IB IRb p-tyr
Figure 3 C 3 coeluted Gai2/IR 2 1 0 - 0,01 0,1 1 10 pretreatment insulin (nM) D 4 IR- phosphorylation fold increasse 2 0 - 0,01 0,1 1 10 pretreatment insulin (nM)
3 2 1 0 Figure 4 A pretreatment - PTX stimulation - ins - ins 100 IR- phosphorylatin % of maximum activity IB P-tyr 50 0 PTX - + ins + + IB IRb B coeluted Gai2/IR fold increase insulin - + + PTX - - +
* Figure 5 120 * 80 IR-phosphorylation % of maximum * 40 0 pretreatment ins - - - - - - added subunits - - ai2 ao as bg ai2+bg