Download
1 / 56
570 likes | 745 Vues
The Application of Genomic Dose-Response Data in Risk Assessment. Harvey Clewell and Rusty Thomas CIIT Centers for Health Research. Overview. Background Alternative Cancer Risk Assessment Approaches Applications of Genomics in Risk Assessment Examples Arsenic

E N D
The Application of Genomic Dose-Response Data in Risk Assessment Harvey Clewell and Rusty Thomas CIIT Centers for Health Research
Overview • Background • Alternative Cancer Risk Assessment Approaches • Applications of Genomics in Risk Assessment • Examples • Arsenic • Issue: location of key dose-dependent transition(s) below observed tumor range • Formaldehyde • Issue: relative contribution of genotoxicity vs. cytotoxicity/proliferation • Genomic Dose-Response Methodology
Alternative Dose-Response Approaches under the New EPA Cancer Guidelines • Linear (default) • Assumes linear relationship of cancer risk to dose from ED10 (dose associated with 10% increase in tumor incidence) to zero • Regulation typically based on 1/10,000 to 1/1,000,000 risk • Most appropriate for directly mutagenic carcinogens with no effect on cell proliferation • Can greatly overestimate risks for chemicals with a mode of action dominated by cytotoxicity and increased cell proliferation
Alternative Dose-Response Approaches under the New EPA Cancer Guidelines • Biologically Based Dose-Response (BBDR) Model • Preferred approach in EPA guidelines • Supports risk estimates below range of observation of tumors • Requires quantitative data on dose-response for key elements in the mode of action • Complexity of detailed BBDR description (e.g. formaldehyde) leads to agency concerns about potential uncertainties
Biologically Based Cancer Dose Response Model • Key Capability: • Describes the • Interaction of • Mutation and • Cell Division • requires data on D/R for • cytotoxicity/apoptosis • cell proliferation • DNA damage • supports investigation of • interactions between • key processes • DNA damage/repair • cell cycle control • cytotoxicity/apoptosis • proliferative pressure Goal: capture dose-dependence of critical, rate-limiting processes -- despite a lack of information on the specific biological details
Alternative Dose-Response Approaches under the New EPA Cancer Guidelines • Margin of Exposure (MoE) • Point of departure can based on LED10 for tumors or obligatory precursor events • MoE selected to address human inter-individual variability and uncertainties in the underlying data • Does not provide quantitative risk estimate • Requires evidence of nonlinear mode of action (the hard part) • Issues: • Alternative / Multiple modes of action • “Lurking” Genotoxicity
Proposed Approach: Biologically Based Dose-Response Modeling of Genomic Data • MoE Approach Using Genomic Dose-Response • It may be a very long time before a fully-developed BBDR model gains acceptance • Simplified dose-response descriptions that maintain a biological basis may be useful in the near term to inform both mode of action and dose-response • Basis of simplified approach: nonlinear dose-response analysis of data on genomic alterations in key cell signal pathways • Combined with quantitative modeling of cell signal pathways, may pave the way to a more detailed BBDR model
Excerpt from SOT RASS Tele- Seminar Presented by Julian Preston (EPA/NHEERL) Conclusions • The conduct of quantitative cancer risk assessment that has minimal reliance on default factors requires knowledge of the key events leading to tumor induction. • The same sorts of information can lead to the development of informative bioindicators of tumor response. • Whole-genome approaches appear to offer the best chance for success. • Computational approaches have to be developed in parallel with the experimental methods. • These key events can be used for the purpose of extrapolations thereby reducing much of the uncertainty currently handicapping the process.
Exposure Tissue Dose Biological Interaction Perturbation Systems Inputs Biological Function Molecular Target(s) (Chemical Mode of Action Link) Impaired Function Adaptation Disease Morbidity & Mortality Mode of Action from a Systems Biology Perspective: Chemical Perturbation of Biological Processes
Uses of Genomic Data (1): • Hazard Identification – Use of pattern recognition analysis to identify similarity of gene changes from uncharacterized compound with changes produced by compounds with known effects • can provide insights into key • elements in mode of action • essentially qualitative • typically, little consideration • given to tissue dosimetry
Uses of Genomic Data (2): Functional Genomics – Characterize interactions of compound with gene regulatory network using temporal analysis and iterative gene over-expression / inhibition • can elucidate key elements • of cellular dose-response • (e.g., switch-like behaviors) • time-consuming, requires • sophisticated analyses • modeling of gene regulation • is in its infancy Increasing Stimulus Input Pulse (Conolly 2004)
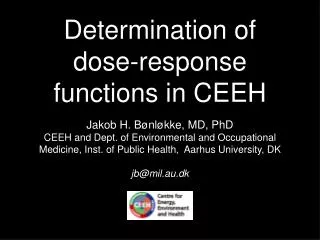
400 (Snow et al. 2002) 300 APE/Ref-1 mRNA Trx mRNA Activity / Amount (% control) 200 Pol b 100 Ligase I 0 0 5 10 15 20 25 µM AsIII Uses of Genomic Data (3): • Dose-Response – Collection of data on genomic responses to a compound over a range of cell/tissue exposure concentrations to identify dose-response for key genomic bio-indicators of response • - provides support for • mode of action hypothesis • requires characterization • of tissue dosimetry or • phenotypic anchoring
Heirarchical Model for Cellular Responses to Stressors (A. Nel) Stressors (heat, pH change, reactive compounds, etc.) Normal Epithelial Cell Pathology Necrosis Atrophy Adaptive State Stressed State Genomic alterations HSP proteins Anti-Apoptotic Biochemical effects GSH/GSSG ratio Interactions with MM Inflammation Toxicity DNA-Repair Proliferative Apoptotic Goal of Genomic Dose-Response Modeling:To identify key elements of each state and the points of transition
Example of Heirarchical Response:Effects of Diesel Exhaust Particles on Cells: (Gilmour et al., 2006, EHP)
PENTAVALENT SPECIES: ARSENATE METHYL ARSONIC ACID DIMETHYL ARSINIC ACID TRIVALENT SPECIES: MMA(III) ARSENITE METHYL ARSONOUS ACID DIMETHYL ARSINOUS ACID Example 1: Inorganic Arsenic Metabolism of Inorganic Arsenic
Evidence for the Carcinogenicity of Inorganic Arsenic • Epidemiology: cancer in multiple tissues • Most common: bladder and lung • Animal bioassays: equivocal • Co-carcinogenic • Mutagenicity: • Arsenite: clastogenic, co-mutagenic • MMA(III): genotoxic(?) • Noncancer toxicity: dermal, vascular • Proliferation • Chemical activity: binding to vicinal dithiols • arsenite, MMA(III)
Key Considerations for the Mode of Action of Inorganic Arsenic • Tumors from inorganic arsenic observed in human populations at around 500 ppb, but animal bioassays at much higher concentrations have been negative • Increased tumor risk from inorganic arsenic in drinking water correlates with MMA/DMA ratio • Suggests role for MMA(III) • Humans exposed to inorganic arsenic in drinking water have higher concentrations of MMA in urine than rodents • Rodents: higher DMA • No evidence of endocrine related tumors in chronically exposed human populations
Target Tissue Increased Inorganic Biochemical Concentrations Mutation Arsenic Targets of of Arsenite Frequency Exposures Arsenic (and Trivalent and Tumors MMA) Dosimetry Modeling Tissue Response Modeling Biologically Based Dose-Response Modeling of Inorganic Arsenic Carcinogenicity Putative Mode of Action: As III / MMA III interactions with key cellular proteins
Primary Target Tissue for Arsenic Carcinogenicity: Urinary Bladder
Oxidative Stress Response (+) (-) Oxidative Stress (+) Co-exposure to Mutagens ROS ROS (+) Proteotoxicity DNA DNA Apoptosis Apoptosis damage damage (+/-) (+/-) Arsenite Cell cycle control Checkpoint Checkpoint stasis stasis DNA repair (+) Proliferative signaling Transition Cancer thru cycle Arsenite Effects and Biological Responses
Review of the Literature on the Dose-Response for the Genomic Effects of Inorganic Arsenic • PUBMED literature search concentrating on genomic response in in vitro and in vivo studies • Prioritization and review of over 300 articles identified • Population and development of inorganic arsenic genomic database
Results of Literature Search • The database contains information from 161 unique studies evaluating 354 specific genes or proteins. • 960 specific entries pertaining to specific genes or proteins • 167 entries pertain to miscellaneous endpoints such as apoptosis, cytotoxicity, or changes in mitotic indexes. • 1127 total database entries.
Summary of the Types of Data Describing Changes in Gene/Protein Levels Following Arsenic Exposure
Dose-Response for the In-Vitro Effects of Arsenic in Normal Cells Gene Expression: Increase Decrease Acute increase, chronic decrease
High-Concentration (1-100 uM) Arsenic Effects on Cells:“Apoptosis” (Anti-Neoplastic Agent) Inflammatory Response Proliferative Signaling Cell Cycle Stasis Induction of Apoptosis
Mid-Concentration (0.1-10 uM) Arsenic Effects on Cells:“Toxicity” (Cancer, Blackfoot Disease) Inflammatory Response Proliferative Signaling Cell Cycle Delay Induction of Apoptosis
Low Concentration (0.01-1 uM) Arsenic Effects on Cells:“Adaptive Response” Delay of Apoptosis Pre-Inflammatory Response Growth Factor Elaboration
EPA / CIIT / EPRI studies on Genomic Dose-Response for Arsenite in Bladder • In vivo: Drinking water exposures • Female C57Bl/J mouse (bioassay strain) • 4 concentrations arsenate plus controls (0.05-50 ppm As) • Genomic analysis of bladder tissues at 1 and 12 weeks • Concentrations of all relevant arsenic species • In vitro: Bladder epithelial cell incubations • Primary bladder epithelial cells • Multiple concentrations, time-points • Concentrations of all relevant arsenic species • Compare mouse and human cells
Dose-Response Characterization • Develop and test dose-response approach with animal data • PK: predict or measure tissue concentrations of active moieties in both short-term exposures and bioassays • PD: link tissue concentration to cellular responses using in vitro and iv vivo genomic data • Apply dose-response approach in human • PK: predict or measure tissue concentrations of active moieties in exposed populations • PD: link tissue concentrations to signal pathway alterations using in vitro genomic data from human cells
Human in vivo Mouse in vivo Predict Bladder Urothelial cells Validate ability to predict in vivo Extend dose-response Human in vitro Mouse in vitro Compare to understand difference in response Bladder cells Bladder cells
Application of Genomic Dose-Response Data to Refine a Human Risk Estimate for Arsenic • Anchor in vitro dose-response to in vivo tumor incidence: • Validate in vitro genomic assays by comparison with data from exposed population in Mongolia (study being conducted by Judy Mumford, EPA) • Apply human genomic dose response to extend tumor dose-response below the region of observation • Proposed approach: • Point of departure based on lowest LED10 for genomic response associated with non-adaptive response • MoE selected to consider uncertainty in genomic data and human interindividual variability
Hypothetical Impact of Population Variability on Cancer Dose-Response for Arsenic in Drinking Water 0.01 Average Individual Dose-Response Sensitive / Resistant Individual Dose-Response Population Dose-Response 0.001 • Susceptibility • Factors: • - Dietary intake • Nutritional status • Other exposures • - selenium • - mutagens • - Genetic factors • - metabolism (GST) • - cell control (P53) Linear Extrapolation Risk 0.0001 0.00001 0.001 0.01 0.1 1.0 Concentration in Drinking Water (mg/L)
60 Kerns et al., 1983 50 Monticello et al., 1990 40 (%) 30 Tumor Response 20 10 0 0 0.7 2 6 10 15 Exposure Concentration (ppm) Example 2: Formaldehyde Formaldehyde bioassay results: rat nasal tumors
Cancer Risk Assessment Considerationsfor Formaldehyde • Increased cell proliferation • Secondary to Cytotoxicity Tumor • DNA interactions • DNA-protein cross-links • Adduct formation Effects Modes of action Dosimetry
Predict decrease in risk at low concentrations using J-shaped dose-response of cell replication 95% UCL on KMU
Final risk assessment model: Hockey stick and 95% upper confidence limit on mutagenicity 95% UCL on KMU
Tissue Phase Reactions Cl2 HOCl + HCl Dosimetry Inhaled Formaldehyde (1) (2) (3) Normal Epithelial Cell Pathology Necrosis Atrophy Adaptive State Stressed State Mechanistic Dose Response Model with Genomic Data • Use specific in vivo studies to develop a dose response model for activation of proteotoxic response pathways following formaldehyde exposure and differentiate dose regions that activate cell homeostasis pathways vs. DNA-repair delays and proliferative pressure
Formaldehyde Genomics Study Design • Expose F344 rats to 0, 0.7, 2.0, and 6.00 ppm formaldehyde for 3 weeks • Assess dose- and time-dependent genomic changes using rat gene chips from Affymetrix • Evaluate gene family changes for heat shock response (proteotoxic), oxidative stress, DNA-repair, cell cycling, apoptosis, etc. • Develop qualitative and quantitative models to link genomic changes with cell behaviors • account for J-shaped cell-proliferation response • incorporate dose response of DNA-damage sensors
Features of Genomics Study Hybridized to a Affymetrix Rat Genome 230 2.0 array with over 30,000 probe sets
Results of Formaldehyde Genomics Study blue: pathology, red: cell proliferation, green: genomics
Results of Formaldehyde Genomics Study blue: pathology, red: cell proliferation, green: genomics
Principal Components Analysis: 0, 0.7, 2 and 6 ppm Conclusion: essentially no effect of formaldehyde exposure at 0.7 ppm
General Observations • No genes were significantly altered at 0.7 ppm in any of the exposures, nor were there any differences in pathology in the noses of the 0.7 ppm exposed rats. • Transient gene changes at 2 ppm (at 5 days of exposure only) • Most not altered at the higher concentrations – including circadian rhythm related genes; • A consistent pattern of genes changed at 6 ppm over time • Most of these genes were part of the group of genes altered immediately after the first 15 ppm, 6 hour exposure. • Although only a small number genes were affected by the 6 ppm exposure, the GO categories for the longer exposure 6 ppm include gene families related to apoptosis.
Next Step: 90 day inhalation study • Exposures: 6 hours/day, 5 days/week, 13 weeks • Concentrations: 0, 0.7, 2, 6, 10, and 15 ppm • (Same as in cancer bioassay) • Endpoints for which dose-responses will be determined: • Genomics • Pathology • Cell proliferation rates • P53 mutation frequency (NCTR) • Goal: determination of dominant factors in mode of action for carcinogenicity • genomic alterations • cytotoxicity • proliferative pressure • mutagenicity
Formaldehyde Genomics Study • Applications of Results • Differentiate dose regions for adaptive (survival) responses and overt DNA damage responses • Evaluate hypothesis of enhanced mutagenic potency at toxic concentrations as compared to lower concentrations • Provide mechanistic basis for U-shaped proliferation dose-response noted in bioassay studies • Consider possible implications for low concentration ‘hormesis’ with formaldehyde and other irritants
Gene Expression Dose Response Data One-Way Analysis of Variance to Identify Genes Changing with Dose Power Model Linear Model Polynomial Model (2°) Polynomial Model (3°) Nested test to Select Best Polynomial Model Select Best Model Remove Genes with BMD > Highest Dose Group Genes by Gene Ontology Category CIIT Estimate BMD and BMDL for each Gene Ontology Category Centers For Health Research Experimental Methods: Integrating Genomic Data with Dose-Response Analysis
Experimental Results: Benchmark Models Goodness-of-Fit to Transcriptomic Data p > 0.05 for 85% of genes