Download
1 / 43
430 likes | 541 Vues
10-Year History of Internet Delay. DK Lee , Kenjiro Cho*, Gianluca Iannaccone **, Sue Moon CAIDA-WIDE-CASFI Joint Workshop April 24, 2010 Division of Computer Science, KAIST *IIJ Research Laboratory **Intel Research, Berkeley. For the Last Few Decades.

E N D
10-Year History of Internet Delay DK Lee, Kenjiro Cho*, GianlucaIannaccone**, Sue Moon CAIDA-WIDE-CASFI Joint Workshop April 24, 2010 Division of Computer Science, KAIST *IIJ Research Laboratory **Intel Research, Berkeley April 24, 2010, dklee@an.kaist.ac.kr
For the Last Few Decades • Many large-scale Internet measurements: • NLANR AMP, CAIDA’s Ark, DIMES, iPlane • UCSD network teloscope, RouteViews, RIPE RIS • About the Internet evolution, we know that • Internet topology has been shrunken in terms of the average AS hop count (by network densification) • Dominant Internet traffic types have changed from web to peer-to-peer traffic April 24, 2010, dklee@an.kaist.ac.kr
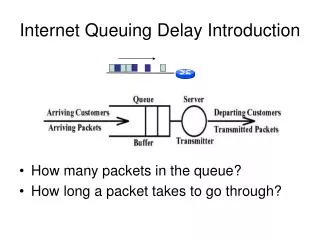
What do we know about the overall Internet delay performance?
What We Know About Internet Delay • Transmission delay • Improved with faster link speed • Propagation delay • Improved with new undersea cables • Queuing and processing delay • Improved with faster devices • Routing Issues • Loops or detours from VPNs, overlays • Delays can be Improved with new AS peering practices April 24, 2010, dklee@an.kaist.ac.kr
Then, Has the Internet grown shorter in delay?
What are the basic rules that govern the long-term dynamics of the Internet delay?
Talk Outline • Has the Internet delay gotten better or worse? • Two main methodologies: • Path stitching • Random sampling of the Internet host pairs • Data sets • Preliminary results • Delay distributions from 2004 to 2009 April 24, 2010, dklee@an.kaist.ac.kr
Reasons for No Authoritative Statement About the Internet-wide Delay • “Random sampling” has not been feasible • No measurement system with access to every AS and subnet of the Internet • No rigorous method to address bias in Internet sampling • Only a selective set of statistics has been possible • Stability, variation, and abrupt changes of delay as a path statistic have been well studied April 24, 2010, dklee@an.kaist.ac.kr
Path Stitching for Random Sampling • Internet-wide path and round-trip delay estimation between any pair of Internet hosts by recycling existing data • Keep database of end-to-end measurement data segmented by the AS • Identifies relevant segments efficiently • Produces path and round-trip delay estimates, by stitching segments together April 24, 2010, dklee@an.kaist.ac.kr
Path Segment Repository • Indexing the path segments by the AS number :A: Intra-domain segments of A : :B: Intra-domain segments of B : A::B Inter-domain segments between A and B : :A:+A::B +:B: = Router-level paths from A to B : a3 a1 a2 a4 b1 b2 b3 c1 c2 c3 traceroute outputs: A B C AS path: a3 a1 a2 a4 b1 b2 b3 March 15, 2010, dklee@an.kaist.ac.kr
Overview of Path Stitching • Question: • Answers: Router-level paths and RTT from a to c ? a ? c Step 1. IP-to-AS mapping A C Step 2. AS path inference A C B :A: rttA :B: rttB :C: rttC Step 3. Path stitching Path = :A::B::C: B::C rttBC A::B rttAB RTT = rttA + rttAB + rttB + rttBC + rttC April 24, 2010, dklee@an.kaist.ac.kr
Results of Path Stitching • We evaluate the Internet-wide coverage and accuracy of the estimated results • More than 70% of pairs are covered by the algorithm • 80% of pairs have absolute errors less than 20msec • Median absolute error is less than 5msec • Reference: DK Lee, Keon Jang, Changhyun Lee, GianlucaIannaccone, Sue Moon, “Internet-wide Path and Delay Estimation from Existing Measurements”, IEEE INFOCOM 2010 Mini-conference April 24, 2010, dklee@an.kaist.ac.kr
Survey Design: Select a Set of Host Pairs to Examine • Random sampling design with size n • Internet consists of N unique pairs of /24 IP prefixes • Extract all routable /24 prefixes from BGP table • Randomly select n=10,000 pairs • Fraction of responded pairs with path stitching • 67% in 2004 and 65% in 2009 April 24, 2010, dklee@an.kaist.ac.kr
Sampling Errors for the Population Median – (1) • Confidence Interval (CI) for the population median estimator: = q0.5 ± • In 2009/06, n = 10,000 = 211.6 ± 4.9 msec • In 2009/06, n = 100,000 = 213.0 ± 1.3 msec April 24, 2010, dklee@an.kaist.ac.kr
Sampling Errors for the Population Median – (2) Sample size n=100,000 is very accurate April 24, 2010, dklee@an.kaist.ac.kr
Sampling Errors for the Population Median – (3) Results for the sample size n>=10,000 are almost identical April 24, 2010, dklee@an.kaist.ac.kr
Data Sets:E2E Measurements + Routing Data • End-to-end path and delay measurement • Traceroute measurements • CAIDA Ark project (from 1998~) • NLANR’s AMP project (from 1999~) • Routing information • BGP routing tables • University of Oregon, RouteViews (from 1997~) • RIPE RIS (from 1999~) April 24, 2010, dklee@an.kaist.ac.kr
Data Processing Oveview • For each YYYY/MM, we process: Queries Path and delay estimations for queries April 24, 2010, dklee@an.kaist.ac.kr
We choose a set of host pairs in each year, and see the delay distribution
Delay distributions from 2004 to 2009 April 24, 2010, dklee@an.kaist.ac.kr
Delay distributions from 2004 to 2009 April 24, 2010, dklee@an.kaist.ac.kr
2004 vs. 2009 • Median delay: 164.0 msec 211.6 msec April 24, 2010, dklee@an.kaist.ac.kr
Median Delays Increase Constantly • Delay distribution has gotten worse from 2004 to 2009, both at first/last mile and in the core • IP/AS hop counts decreased end-to-end • IP hop counts: 14.8 (2004) 14.1 (2009) • AS hop counts: 3.77 (2004) 3.65 (2009) April 24, 2010, dklee@an.kaist.ac.kr
Delay distributions from 2004 to 2009 (For the Same Pairs) • Only 2432 pairs are constantly responded from 2004 to 2009 April 24, 2010, dklee@an.kaist.ac.kr
Delay distributions from 2004 to 2009 (For the Same Pairs) April 24, 2010, dklee@an.kaist.ac.kr
2004 vs. 2009 (For the Same Pairs) • Median delay: 163.5 msec 156.931 msec April 24, 2010, dklee@an.kaist.ac.kr
Median Delays improved(For the Same Pairs) • Delay distributions for the same set of sample host pairs remain almost identical or slightly improved from 2004 to 2009 • IP/AS hop counts decreased April 24, 2010, dklee@an.kaist.ac.kr
Finding the corroborating Evidence for the observations • IP address usage have expanded from 2004 to 2009 • /24 prefixes of those hosts in 2009 existed in 2004? • ASes of those hosts in 2009 existed in 2004? • In sampled pairs in 2009, compared to 2004, 1729ASes are disappeared, 2091Ases are newly appeared. • Network densification helps AS hop count to decrease. Does it also help IP hop count or delay to decrease? April 24, 2010, dklee@an.kaist.ac.kr
Other Challenges • Analyzing the delay distribution in 1999 • Skitter’s old-format does not have hop-by-hop delays • NLANR AMP dataset is too small • RouteViews have very restricted number of peers • Effect of non-response • Where does the missing 35% come from? • Effect of measurement errors April 24, 2010, dklee@an.kaist.ac.kr
Conclusion • We present the methodology for the Internet delay history reconstruction and analysis: • Path-stitching with existing measurements • Random sampling of the Internet host pairs • Our approach is very feasible in showing insight about the overall Internet delay distribution April 24, 2010, dklee@an.kaist.ac.kr
Thank You! • Any Questions? • We are looking for other traceroute outputs and BGP table snapshots archived before 2000 April 24, 2010, dklee@an.kaist.ac.kr
Backup Slides “To get to the essence of things, one has to work long and hard” -- Vincent van Gogh
What If There Are • Too few segments: • Too many segments: :A: :B: ? :C: A::B ? B::C ... ... April 24, 2010, dklee@an.kaist.ac.kr
When There Are Too Few or No Segments
We Employ Approximations (i) Missing AS • No solutions (other than collecting more measurements. ) (ii) Missing inter-domain segment • Search for reverse path segments. (i.e., if we cannot find A::B, use B::A instead) (iii) Path segments do not rendezvous at the same address (i.e., the segment cannot be stitched) • Identify nearby segments (on the same router, PoP, Prefix) :A: :B: B::A X Y A Z W X::A::W = ? April 24, 2010, dklee@an.kaist.ac.kr
When There Are Too Many Segments
We Apply Preference Rules • Rank the list of candidate path segments • Eliminate candidates as many as possible while keeping the most accurate one. • Reflect the actual routing mechanism ... Source AS Intermediate ASes ... Destination AS Rule #1, 2, 3 Rule #1, 2, 3 Rule # 2, 3 April 24, 2010, dklee@an.kaist.ac.kr
Rule #1: Proximity • Preference to the path segments that closest to the queried source and destination address Query: a.b.c.d --> x.y.z.w x.y.z.1 x.y.z.2 a.b.c.1 a.b.c.2 a.b.1.1 d.b.1.2 Source AS April 24, 2010, dklee@an.kaist.ac.kr
Rule #2: Destianation-bound • Preference to the segments from traceroutes with the same destination prefix traceroutes to u.v.w.1 Query: a.b.c.d --> x.y.z.w traceroutes to x.y.z.1 Original traceroutes Source AS April 24, 2010, dklee@an.kaist.ac.kr
Rule #3: Most Recent • Preference to the most recent path segment YYYYMMDD-12:30:00 Query: a.b.c.d --> x.y.z.w YYYYMMDD-10:30:00 traceroutes to x.y.z.1 Original traceroutes Source AS April 24, 2010, dklee@an.kaist.ac.kr
Comparisons with iPlane – (1) • CDF of absolute errors for pl-easy pairs Errors <= 20ms for 90% of pl-easy pairs April 24, 2010, dklee@an.kaist.ac.kr
Comparisons with iPlane – (1) • CDF of absolute errors for pl-hard pairs Very promising results: With accurate AS paths inference, errors <= 20ms for 80% of pl-hard pairs April 24, 2010, dklee@an.kaist.ac.kr