Download
1 / 34
460 likes | 1.22k Vues
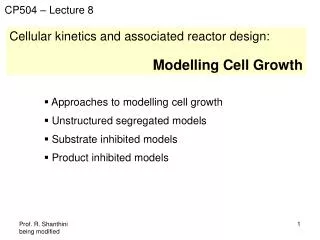
CP504 – Lecture 8. Cellular kinetics and associated reactor design: Modelling Cell Growth. Approaches to modelling cell growth Unstructured segregated models Substrate inhibited models Product inhibited models. Cell Growth Kinetics.

E N D
CP504 – Lecture 8 Cellular kinetics and associated reactor design: Modelling Cell Growth • Approaches to modelling cell growth • Unstructured segregated models • Substrate inhibited models • Product inhibited models
Cell Growth Kinetics The most commonly used model for μ is given by the Monod model: μm CS (47) μ = KS + CS where μmax and KS are known as the Monod kinetic parameters. Monod Model is an over simplification of the complicated mechanism of cell growth. However, it adequately describes the kinetics when the concentrations of inhibitors to cell growth are low.
Cell Growth Kinetics Let’s now take a look at the cell growth kinetics, limitations of Monod model, and alternative models.
Approaches to modelling cell growth: Structured Models (cell population is treated as a multi-component system) Unstructured Models (cell population is treated as single component) Nonsegregated Models (cells are treated as homogeneous) Segregated Models (cells are treated heterogeneous)
Approaches to modelling cell growth: Structured Segregated Models (cell population is treated as a multi-component system, and cells are treated heterogeneous) Unstructured Nonsegregated Models (cell population is treated as single component, and cells are treated as homogeneous) Most realistic, but are computationally complex. Simple and applicable to many situations.
Unstructured, nonsegregated models: Monod model: Most commonly used model for cell growth μm CS μ = KS + CS μ: specific (cell) growth rate μm : maximum specific growth rate at saturating substrate concentrations CS : substrate concentration KS : saturation constant (CS = KS when μ = μm / 2)
Unstructured, nonsegregated models: Monod model: Most commonly used model for cell growth μm CS μ = KS + CS μ (per h) μm = 0.9 per h Ks = 0.7 g/L
Assumptions behind Monod model: • - One limiting substrate • Semi-empirical relationship • Single enzyme system with M-M kinetics being responsible for the uptake of substrate • Amount of enzyme is sufficiently low to be growth limiting • Cell growth is slow • Cell population density is low
Other unstructured, nonsegregated models (assuming one limiting substrate): Blackman equation: μ = μm if CS ≥ 2KS μm CS if CS < 2KS μ = 2 KS Tessier equation: μ = μm [1 - exp(-KCS)] μm CSn Moser equation: μ = KS + CSn μm CS Contois equation: μ = KSX CX + CS
Blackman equation: μ = μm if CS ≥ 2 KS This often fits the data better than the Monod model, but the discontinuity can be a problem. μm CS if CS < 2 KS μ = 2 KS μ (per h) μm = 0.9 per h Ks = 0.7 g/L
Tessier equation: μ = μm [1 - exp(-KCS)] μ (per h) μm = 0.9 per h K = 0.7 g/L
Moser equation: When n = 1, Moser equation describes Monod model. μm CSn μ = KS + CSn μ (per h) μm = 0.9 per h Ks = 0.7 g/L
Contois equation: Saturation constant (KSX CX) is proportional to cell concentration μm CS μ = KSX CX + CS
Extended Monod model: Extended Monod model includes a CS,min term, which denotes the minimal substrate concentration needed for cell growth. μm (CS – CS,min) μ = KS + CS – CS,min μ (per h) μm = 0.9 per h Ks = 0.7 g/L CS,min = 0.5 g/L
Monod model for two limiting substrates: CS1 CS2 μm μ = KS1 + CS1 KS2 + CS2
Monod model modified for rapidly-growing, dense cultures: Monod model is not suitable for rapidly-growing, dense cultures. The following models are best suited for such situations: μm CS μ = KS0 CS0 + CS μm CS μ = KS1 + KS0 CS0 + CS where CS0 is the initial substrate concentration and KS0 is dimensionless.
Monod model modified for substrate inhibition: Monod model does not model substrate inhibition. Substrate inhibition means increasing substrate concentration beyond certain value reduces the cell growth rate. μ (per h)
Monod model modified for cell growth with noncompetitive substrate inhibition: μm μ = (1 + KS/CS)(1 + CS/KI) μm CS = KS + CS + CS2/KI+ KSCS/KI μm CS μ = If KI >> KS then KS + CS + CS2/KI where KI is the substrate inhibition constant.
Monod model modified for cell growth with competitive substrate inhibition: μm CS μ = KS(1 + CS/KI) + CS where KI is the substrate inhibition constant.
Monod model modified for cell growth with product inhibition: Monod model does not model product inhibition (where increasing product concentration beyond certain value reduces the cell growth rate) For competitive product inhibition: μm CS μ = KS(1 + Cp/Kp) + CS For non-competitive product inhibition: μm μ = (1 + KS/CS)(1 + Cp/Kp) where Cp is the product concentration and Kp is a product inhibition constant.
Monod model modified for cell growth with product inhibition: Ethanol fermentation from glucose by yeasts is an example of non-competitive product inhibition. Ethanol is an inhibitor at concentrations above nearly 5% (v/v). Rate expressions specifically for ethanol inhibition are the following: μm CS (1 + Cp/Cpm) μ = (KS + CS) μm CS exp(-Cp/Kp) μ = (KS + CS) where Cpm is the product concentration at which growth stops.
Monod model modified for cell growth with toxic compound inhibition: For competitive toxic compound inhibition: μm CS μ = KS(1 + CI/KI) + CS For non-competitive toxic compound inhibition: μm μ = (1 + KS/CS)(1 + CI/KI) where CI is the product concentration and KI is a constant to be determined.
Monod model extended to include cell death kinetics: μm CS - kd μ = KS + CS where kdis the specific death rate (per time).
Other unstructured, nonsegregated models (assuming one limiting substrate): Luedeking-Piret model: rP = rX + β CX Used for lactic acid formation by Lactobacillus debruickii where production of lactic acid was found to occur semi-independently of cell growth.
Modelling μ under specific conditions: There are models used under specific conditions. We will learn them as the situation arises.
Limitations of unstructured non-segregated models: • No attempt to utilize or recognize knowledge about cellular metabolism and regulation • Show no lag phase • Give no insight to the variables that influence growth • Assume a black box • Assume dynamic response of a cell is dominated by an internal process with a time delay on the order of the response time • Most processes are assumed to be too fast or too slow to influence the observed response.
Filamentous Organisms: • Types of Organisms • Moulds and fungi • bacteria or yeast entrapped in a spherical gel particle • formation of microbial pettlets in suspension • Their growth does not necessarily increase the number of cells, but increase them in length, and hence there will be changes in physical properties like density of the cell mass and viscosity of the broth • Model - no mass transfer limitations where R is the radius of the cell floc or pellet or mold colony
Filamentous Organisms: • The product formation may be growth associated, which means rate of product formation is proportional to the cell growth rate (i.e., product is formed as a result of the primary metabolic function of the cell) rP = rX • It happens mostly during the exponential growth phase • Examples: • production of alcohol by the anaerobic fermentation of glucose by yeast • production of gluconic acid from glucose by Gluconobactor
Filamentous Organisms: • The product formation may be non-growth associated, which means rate of product formation is proportional to the cell concentration rather than cell growth rate (i.e., product is formed as a result of the secondary metabolism) rP = β CX • It happens at the end of the exponential growth phase or only after entering into the stationary phase • Examples: • production of antibiotics in batch fermentations • production of vitamins in batch fermentations
Other unstructured, nonsegregated models (assuming one limiting substrate): Luedeking-Piret model: rP = rX + β CX Used for lactic acid formation by Lactobacillus debruickii where production of lactic acid was found to occur semi-independently of cell growth.
Filamentous Organisms: Then the growth of the biomass (M) can be written as where
Filamentous Organisms: • Integrating the equation: • M0 is usually very small then • Model is supported by experimental data.
Chemically Structured Models : • Improvement over nonstructured, nonsegregated models • Need less fudge factors, inhibitors, substrate inhibition, high concentration different rates etc. • Model the kinetic interactions amoung cellular subcomponents • Try to use Intrinsic variables - concentration per unit cell mass- Not extrinsic variables - concentration per reactor volume • More predictive • Incorporate our knowledge of cell biology