Download
1 / 18
180 likes | 198 Vues
Chapter 8: Trigonometric Functions and Applications. 8.1 Angles, Arcs, and Their Measures 8.2 The Unit Circle and Its Functions 8.3 Graphs of the Sine and Cosine Functions 8.4 Graphs of the Other Circular Functions 8.5 Functions of Angles and Fundamental Identities

E N D
Chapter 8: Trigonometric Functions and Applications 8.1 Angles, Arcs, and Their Measures 8.2 The Unit Circle and Its Functions 8.3 Graphs of the Sine and Cosine Functions 8.4Graphs of the Other Circular Functions 8.5 Functions of Angles and Fundamental Identities 8.6 Evaluating Trigonometric Functions 8.7 Applications of Right Triangles 8.8 Harmonic Motion
8.3 Graphs of the Sine and Cosine Functions • Many things in daily life repeat with a predictable pattern. Because sine and cosine repeat their values over and over in a regular pattern, they are examples of periodic functions. Periodic Function A periodic function is a function f such that f(x) = f(x + np), for every real number x in the domain of f , every integer n, and some positive real number p. The smallest possible positive value of p is the period of the function.
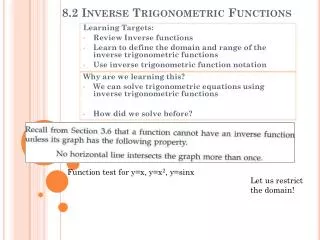
8.3 Graph of the Sine Function • From the graph we can see that as s increases, sin s oscillates between 1. • Using x rather than s, we can plot points to obtain the graph y = sin x. • The graph is continuous on (–,). • Its x-intercepts are of the form n, n an integer. • Its period is 2. • Its graph is symmetric with respect to the origin, and it is an odd function.
8.3 Graph of the Cosine Function • The graph of y = cos x can be found much the same way as y = sin x. • Note that the graph of y = cos x is the graph y = sin x translated units to the left. • The graph is continuous on (–,). • Its x-intercepts are of the form (2n + 1) , n an integer. • Its period is 2. • Its graph is symmetric with respect to the y-axis, and it is an even function.
8.3 Graphing Techniques, Amplitude, and Period Example Graph y = 2 sin x, and compare to the graph of y = sin x. Solution From the table, the only change in the graph is the range, which becomes [–2,2].
8.3 Amplitude • The amplitude of a periodic function is half the difference between the maximum and minimum values. • For sine and cosine, the amplitude is Amplitude The graph of y = a sin x or y = a cos x, with a 0, will have the same shape as y = sin x or y = cos x, respectively, except with range [–|a|, |a|]. The amplitude is |a|.
8.3 Period • To find the period of y = sin bx or y = cos bx, solve the inequality for b > 0 • Thus, the period is • Divide the interval into four equal parts to get the values for which y = sin bx or y = cos bx is –1, 0, or 1. These values will give the minimum points, x-intercepts, and maximum points on the graph.
8.3 Period For b > 0, the graph of y = sin bx will resemble that of y = sin x, but with period Also, the graph of y = cos bx will resemble that of y = cos x, but with period
8.3 Graphing y = cos bx Example Graph over one period. Analytic Solution
8.3 Graphing y = cos bx Graphing Calculator Solution Use window [0,3] by [–2,2], with Xscl = 3/4. Choose Xscl = 3/4 so that x-intercepts, maximums, and minimums coincide with tick marks on the axis.
8.3 Guidelines for Sketching Graphs of the Sine and Cosine Functions • To graph y = a sin bx or y = a cos bx, with b > 0, • Find the period, Start at 0 on the x-axis, and • mark off a distance of • 2. Divide the interval into four equal parts. • 3. Evaluate the function for each of the five x-values resulting from Step 2. The points will be the maximum points, minimum points, and x-intercepts. • 4. Plot the points found in Step 3, and join them with a sinusoidal curve having amplitude |a|. • 5. Draw the graph over additional periods, as needed.
8.3 Graphing y = a sin bx Example Graph y = –2 sin 3x. Solution • Period: • Divide the interval into four equal parts to get the x-values
8.3 Graphing y = a sin bx • Plot the points (x, –2 sin 3x) from the table. • Notice that when a is negative, the graph of y = –2 sin 3x is a reflection across the x-axis of the graph of y = |a| sin bx.
8.3 Translations • Horizontal • The graph of y = f(x – d) translates the graph of y = f(x) d units to the right if d > 0 and |d| units to the left if d < 0. • A horizontal translation is called a phase shift and the expression x – d is called the argument. • Vertical • The graph of y = c + f(x) translates the graph of y = f(x) c units upward if c > 0 and |c| units downward if c < 0.
8.3 Further Guidelines for Sketching Graphs of the Sine and Cosine Functions A function of the form y = c + a sin[b(x – d)] or y = c + a cos[b(x – d)], b > 0, can be graphed as follows. Method 1Follow these steps. 1. Find an interval whose length is one period by solving the three part inequality 0 <b(x – d) < 2. 2. Divide the interval into four equal parts. 3. Evaluate the function for each of the five x-values resulting from Step 2. The points will be the maximum points, minimum points, and points that intersect the line y = c. 4. Plot the points found in Step 3, and join them with a sinusoidal curve having amplitude |a|. 5. Draw the graph over additional periods, as needed.
8.3 Further Guidelines for Sketching Graphs of the Sine and Cosine Functions A function of the form y = c + a sin[b(x – d)] or y = c + a cos[b(x – d)], b > 0, can be graphed as follows. Method 2 First graph y = a sin bx or y = a cos bx. The amplitude of the function is |a|, and the period is Then use translations to graph the desired function. The vertical translation is c units up if c > 0 and |c| units down if c < 0. The horizontal translation (phase shift) is d units to the right if d > 0 and |d| units to the left if d < 0.
8.3 Graphing y = c + a sin b(x – d) Example Graph y = –1 + 2 sin(4x + ). Solution Express y in the form c + a sin [b(x – d)]. Amplitude = 2 Period Translate |-1| = 1 unit downward and units to the left. Start the first period at x-value and end the first period at