Download
1 / 34
340 likes | 469 Vues
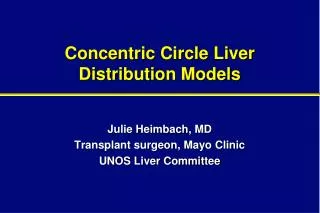
This presentation by Dr. Julie Heimbach, a transplant surgeon at Mayo Clinic, discusses the implementation and outcomes of concentric circle models in liver distribution. Highlighting recent modifications to UNOS policies for broader sharing, it evaluates the impact on waiting list mortality, access for urgent candidates, and post-transplant survival rates. The study utilizes data from various donor and recipient combinations, providing insight into how concentric circles can improve equity in liver transplantation across diverse geographic regions.

E N D
Concentric Circle Liver Distribution Models Julie Heimbach, MD Transplant surgeon, Mayo Clinic UNOS Liver Committee
MA RI DE MD PR & US VI HI Current Distribution Unit 58 OPO/Donor Service Areas Arbitrary, with wide variability in size, and population (1.3 - 18.7 million people.)
Background • During last year’s public comment period for broader sharing, multiple regions/individual public comments suggested looking instead at concentric circle model. • This has been the long-standing model used in thoracic transplantation, modified in 2006 for hearts.
HEART DISTRIBUTION UNITS ZONE D: 1500-<2500 miles ZONE C: 1000-<1500 miles ZONE B: 500-<1000 miles ZONE A: < 500 miles LOCAL (DSA) ZONE E: >2500 miles
ALLOCATION ORDERING:Adult donors Local Status 1A Local Status 1B Zone A Status 1A Zone A Status 1B Local Status 2 Zone A Status 1A Zone A Status 1B Zone B Status 1A Zone B Status 1B Zone A Status 2 Zone B Status 2 • Zone C Status 1A • Zone C Status 1B • Zone C Status 2 • Zone D Status 1A • Zone D Status 1B • Zone D Status 2 • Zone E Status 1A • Zone E Status 1B • Zone E Status 2
FOR DEATHS PER 100 PATIENT-YEARS ON THE WAITING LIST: Adult Candidates * Inactive (status 7) is combined with the previous active status ** Deaths include those reported to the OPTN or to SSDMF while on waiting list or within 7 days of non-transplant removal.
SURVIVAL WITHIN 1 YEAR:Adult recipients: All statuses combined NOTE: Scale of survival axis has been expanded.
SURVIVAL WITHIN 1 YEAR:Adult recipients: Status 1A at transplant NOTE: Scale of survival axis has been expanded.
CONCLUSIONS The policy modification appears to be meeting its goals: Waiting list mortality has declined for adult candidates. A larger percentage of transplants are being performed in urgent candidates. Post-transplant survival has not been adversely affected.
Liver Concentric Circle Model: • Using LSAM, the SRTR modeled a system using concentric circles for distribution units for all adult and pediatric donors. • Additional runs were performed with sharing only for MELD > upper thresholds of 35, 32, 29, 25, and 22.
Methods • Study Population • Data from listed candidates and available donor organs from 1/1/2006 to 12/31/2006 were included • Analytical Approach • LSAM was used to compare concentric circles for sharing above various MELD/PELD thresholds versus current. Results= average of 10 separate runs. • Endpoints: • deaths (pre and post) • median distance traveled
1 nm=1.15 mi = 250 nm
1 nm=1.15 mi = 500 nm
Concentric Circles for Adult Deceased Donor Livers– Current System Regional – Status 1A/1B Local – MELD/PELD 15 Regional – MELD/PELD 15 Local – MELD/PELD < 15 Regional – MELD/PELD < 15 National – Status 1A National – Status 1B National – MELD/PELD
Concentric Circles for Adult Deceased Donor Livers– February 2010 Concentric 250: 35 (29, 25, 22) 0-250 NM – Status 1A then 1B 0-250NM – MELD/PELD 35 (29, 25, 22) 250-500 NM – Status 1A then 1B 0-250 NM – MELD/PELD 15-34 (29, 25, 22) 250-500NM– MELD/PELD 35 (29, 25, 22) 0-250NM – MELD/PELD < 15 500-1,000NM – Status 1A then 1B 250-500NM – MELD/PELD 15-34 (29, 25, 22) 500-1,000NM – MELD/PELD 35 (29, 25, 22) 250-500NM – MELD/PELD < 15 1,000+ NM – Status 1A/1B 500-1,000 NM – MELD/PELD < 35 (29, 25, 22) 1,000+ NM – MELD/PELD Note: NM = nautical mile radii (w/ donor hospital at the center)
0-250 NM Status 1A 250-500 NM Status 1A 0-250 NM Status 1B 250-500 NM Status 1B 0-250 NM MELD/PELD 35 (32, 29, 25, 22) 250-500 NM MELD/PELD 35 (32, 29, 25, 22) 0-250 NM MELD/PELD 15-34 (31, 28, 24, 21) 250-500 NM MELD/PELD 15-34 (31, 28, 24, 21) 500-1000 NM Status 1A 500-1000 NM Status 1B 500-1000 NM MELD/PELD 15 1000+ NM Status 1A 1000+ NM Status 1B 1000+ NM MELD/PELD 15 0-250 NM MELD/PELD < 15 250-500 NM MELD/PELD < 15 500-1000 NM MELD/PELD < 15 1000+ NM MELD/PELD < 15 Concentric Circles: March 2010 Con250 15-35 (32, 29, 25, 22) Note: NM = nautical mile radii (w/ donor hospital at the center)
Concentric Circles for Adult DD Livers: March February March Con250 15-35 (32, 29, 25, 22) 0-250 NM Status 1A 250-500 NM Status 1A 0-250 NM Status 1B 250-500 NM Status 1B 0-250 NM MELD/PELD 35 (32, 29, 25, 22) 250-500 NM MELD/PELD 35 (32, 29, 25, 22) 0-250 NM MELD/PELD 15-34 (31, 28, 24, 21) 250-500 NM MELD/PELD 15-34 (31, 28, 24, 21) 500-1000 NM Status 1A 500-1000 NM Status 1B 500-1000 NM MELD/PELD 15 1000+ NM Status 1A 1000+ NM Status 1B 1000+ NM MELD/PELD 15 0-250 NM MELD/PELD < 15 250-500 NM MELD/PELD < 15 500-1000 NM MELD/PELD < 15 1000+ NM MELD/PELD < 15 0-250 NM – Status 1A, then 1B 0-250NM – MELD/PELD 35 (29, 25, 22) 250-500 NM – Status 1A, then 1B 0-250 NM – MELD/PELD 15-34 (29, 25, 22) 250-500NM– MELD/PELD 35 (29, 25, 22) 0-250NM – MELD/PELD < 15 500-1,000NM – Status 1A 500-1,000 NM – Status 1B 250-500NM – MELD/PELD 15-34 (29, 25, 22) 500-1,000NM – MELD/PELD 35 (29, 25, 22) 250-500NM – MELD/PELD < 15 1,000+ NM – Status 1A 1,000+ NM – Status 1B 500-1,000 NM – MELD/PELD < 35 (29, 25, 22) 1,000+ NM – MELD/PELD
Key differences Feb. to March: • Feb: small circle for 1A, then 1B, then for MELD> 35 (or other). big circle for 1A, then 1B. back to the small circle for 15-35, then big circle >35(other), then to small circle for MELD <15. • March: small circle 1A, then big circle for 1A. small circle 1B, then big circle for 1B. small circle >35 (or other lower), big circle >35 0-250 for 15-35, then 250-500 15-35, then national before 0-150 for MELD <15.
Median DistanceBetween Donor Hospital and Transplant Center: February
Median Distance Between Donor Hospital and Transplant Center: March total increase 60-80 mi
Decrease in Total Deaths (vs. Current)- March Overall 83- 105 fewer deaths
Number of Transplants by MELD: March *More 1A, MELD >20. Overall ~110 fewer transplants.
Number of Deaths by Type: March *Overall ~83- 105 fewer deaths, slightly more post TX.
Number of WL Deaths by MELD- March *similar small decrease in WL death in each MELD group
Summary • All of the two tiered concentric circle systems resulted in higher median distances traveled vs. current. • The distance increased as the MELD score for the upper threshold was reduced • All of the two tiered concentric circle systems resulted in fewer total deaths compared to current allocation rules in the simulations. • The decrease in the number of deaths ranged from83 to 105.
Median Distance vs. Decrease in Total Deaths Reg Shr Benefit Five Zones Concentric 250_1525 National 250_1532 250_1529 15/25 15/29 250_1522 15/22 15/35 250_1535 Concentric 35 15/32 Shr Pos Benefit Reg Shr MELD 250_29 250_22 250_35 250_25 Shr35R, National 15 Concentric Current
Flight cost estimates: Life Source (MNOP) 2007-2009 =MNOP (MN, ND, SD) Region 7= MN,SD, ND, WI, IL 2nd Tier =IA, NE, KS, MO, MI, IN • Local (MNOP) flight= $ 5,271 (n=520) • Import region 7 flight= $ 5,617 (n=52) • Import 2nd tier= $ 7,629 (n=22) • Import national= $ 13,273 (n=55)