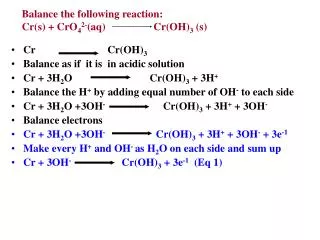
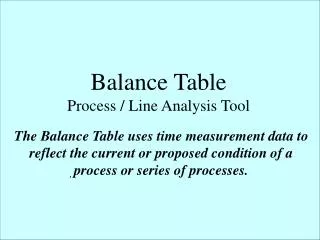
Balance Table Process / Line Analysis Tool
Balance Table Process / Line Analysis Tool. The Balance Table uses time measurement data to reflect the current or proposed condition of a process or series of processes. 180. 160. 140. 120. Observed Cycle Time (sec). 100. 80. 60. 40. 20. 0. 1. 2. 3. 4. 5. Process Numbers.

Balance Table Process / Line Analysis Tool
E N D
Presentation Transcript
Balance Table Process / Line Analysis Tool The Balance Table uses time measurement data to reflect the current or proposed condition of a process or series of processes.
180 160 140 120 Observed Cycle Time (sec) 100 80 60 40 20 0 1 2 3 4 5 Process Numbers Company Name Balance Table - Current Condition
180 Takt Time Target Cycle Time 160 140 120 Observed Cycle Time (sec) 100 80 60 40 20 0 1 2 3 4 5 Process Numbers Company Name Balance Table - Current Condition 159” 151”
180 Takt Time Target Cycle Time 160 140 Standard Time 120 Observed Cycle Time (sec) 100 80 60 40 20 0 1 2 3 4 5 Process Numbers Company Name Balance Table - Current Condition 159” 152 151” 140 130 120 115
180 Takt Time Target Cycle Time 160 Highest Time 140 Standard Time Lowest time 120 Observed Cycle Time (sec) 100 80 60 40 20 0 1 2 3 4 5 Process Numbers Company Name Balance Table - Current Condition 159” 152 151” 140 130 120 115
180 Takt Time Target Cycle Time 160 Highest Time 140 Standard Time Lowest time 120 Observed Cycle Time (sec) 100 80 60 40 20 0 1 2 3 4 5 Process Numbers Company Name Balance Table - Current Condition 159” 152 151” 140 130 120 NVA= 53% 115 NVA= 34% NVA= 15% NVA= 35% NVA= 58% VA= 85% VA= 66% VA= 65% VA= 47% VA= 42%
By plotting the Highest observed cycle time, Lowest observed cycle time and Representative (Standard) observed cycle time a good analysis of the line or process can be made. 180 Takt Time Target Cycle Time 160 Highest Time 140 Standard Time Lowest time 120 Observed Cycle Time (sec) 100 80 60 40 20 0 1 2 3 4 5 Process Numbers Company Name Balance Table - Current Condition Bottleneck Process Instability • Bottlenecks can be identified. 159” 152 • High Fluctuation will indicate • process instability / abnormal • conditions (the need for • problem solving). 151” 140 130 120 • Continuous Improvement Target can be determined. NVA= 53% 115 NVA= 34% NVA= 15% NVA= 35% NVA= 58% EXAMPLE: Total Cycle Time= Required # Takt Time of processes 6574.1 (Actual # of 159” processes required) C.I. Target= Reduce # of processes to 4 VA= 85% VA= 66% VA= 65% VA= 47% VA= 42% • Continuous Improvement strategies • can be developed i.e. • 1. - Reduce waste • 2. - Rebalance work elements from process • # 5 (Targeted Process) into processes 2 and 4. • 3. Accumulate all wait time into process # 5.