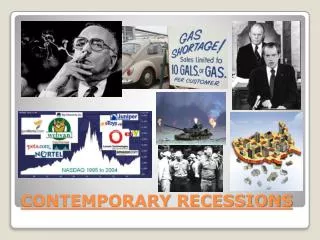
CONTEMPORARY RECESSIONS
250 likes | 513 Vues
CONTEMPORARY RECESSIONS. RECESSION OF 1973-1975 RECESSION OF 1981-1982 RECESSION OF 1990-1991 RECESSION OF 2001 RECESSION OF 2008-2009. HOW DO THESE RECESSIONS COMPARE?.

CONTEMPORARY RECESSIONS
E N D
Presentation Transcript
RECESSION OF 1973-1975 RECESSION OF 1981-1982 RECESSION OF 1990-1991 RECESSION OF 2001 RECESSION OF 2008-2009 HOW DO THESE RECESSIONS COMPARE?
A quadrupling of oil prices by OPEC coupled with high government spending because of the Vietnam War led to stagflation in the U.S. • The period was also marked by the 1973 oil embargo and the 1973–1974 stock market crash. 1973-1975 STAGFLATION
The biggest concern was the reduction in investment spending. • From 1973IV to 1975II the level of investment purchases declined by 89 billion 1972 value dollars. • Congress enacted a tax cut. Ford’s head of the CEA, Alan Greenspan CAUSES AND REMEDIES
The Federal budget deficit leaped from $25 billion to $54 billion to $102 billion. • Investment purchases, financed in part by private borrowing, increased in the third quarter by over 19 percent. Investment was enticed in by the credible prospect of an economy that would be once again growing. THE RECESSION ENDS WITH NO CROWDING OUT
TWO FACTORS: SHARPLY INCREASING OIL PRICES AND TIGHT MONETARY POLICY
To finally end the long battle with inflation, Fed Chairman Paul Volcker tightened the screws on the economy. • Business bankruptcies rose 50%, agricultural exports declined, crop prices fell, and interest rates rose. • Auto sales and residential purchases evaporated. DOUBLE DIGIT INFLATION ATTACKED BY FED
In March 1980, inflation approached 14.8%. By July 1983, it was under 2.5% • Significant tax cuts and increases in govt. spending, especially in Defense, ushered in a deficit driven recovery • Though the fiscal moves were framed as “supply-side”, in the end they spurred a massive amount of consumption KEYNESIANISM ON STEROIDS
The S&L Crisis, Desert Storm, rising U.S. debt and growing consumer pessimism combined with the weak economy 1990-1991 RECESSION AND THE DOWNFALL OF G.H.W. BUSH
REVELATIONS • Investors worried about national debt • S&L crisis effects many households and creates a massive bailout adding to the deficits • Fed raises interest rates in 1989 in response to 5.1% infl. • 1990 invasion of Kuwait causes oil price spike • Recession only lasted from July 1990 to March 1991, but unemployment was still 8% in June 1992 http://www.youtube.com/watch?feature=player_embedded&v=7ffbFvKlWqE DEMONSTRATED THE IMPORTANCE OF FINANCIAL MARKETS
A run-up in home prices in the 80s hit a wall • Consumers very pessimistic, new home starts at lowest level since 1946 • Households burdened with high consumer debt • Bush reneges on his “read my lips” pledge • Bush blames Greenspan for being too cautious in stimulating the economy • Large layoffs in defense related industries • GDP growth picks up in 1992, but jobless recovery RECOVERY IS SLUGGISH BEFORE ECONOMY CATCHES STRIDE
The 2001 recession was barely a recession at all. • Output only shrank for two, non-consecutive quarters, and in each the rate of contraction was barely over 1%. • The unemployment rate never got above 5.9% during the recession, and it subsequently peaked at 6.3%. • It lasted 8 months DESCRIBED AS MILD AND SHALLOW
A historic speculative bubble from 1997-2000 • Investors were willing to overlook traditional metrics such as P/E ratio in favor of confidence in technological advancements. • Companies were seeing their stock prices shoot up if they simply added an "e-" prefix to their name and/or a ".com" to the end. • The low interest rates in 1998–99 helped increase the start-up capital amounts. THE DOT-COM BUBBLE
Over 1999 and early 2000, the U.S. Federal Reserve increased interest rates six times, and the economy began to lose speed. • The recession began in March 2001 • The subsequent fall in business investment and outlays led to a contraction. • The attacks on 9/11 extended the pessimism and created an official recession • The effects were relatively contained THE NATION RECOVERED IN THE AFTERMATH OF 9/11
HOUSING PRICES NEVER FALL AND HOMEOWNERS ALWAYS REPAY THEIR MORTGAGES SECURITIZE THESE MORTGAGES AND SELL THEM AROUND THE WORLD WITH A “AAA” BLESSING 2008-2009, THE WRONG KIND OF IRRATIONAL EXUBERANCE
ORIGINS OF THE CRISIS During and after the mild recession of 2001, the Fed lowers interest rates Investors seek a safer play after the dot-com fiasco Globalization has created a lot of wealth around the world looking for safety The Bush administration makes public remarks promoting home owning Congress reduces regulations and capital requirements for creating home loans
The MBS were multi-layered securities constructed of mortgages of differing quality levels. • The assumption that U.S. housing was a sure bet led agencies to rate these as AAA lowering investor’s guard. • By June of 2007, financial firms and hedge funds owned more than $2 trillion of securitized debt from sub-prime loans. • Financial institutions were allowed to book bets on whether people would default on their mortgages, credit default swaps A MORALLY HAZARDOUS CASINO
Homeownership peaks in early 2005 at 70% of households • The Fed raises interest rates • Home prices fall • ARMs adjust higher increasing payments for sub-prime borrowers • Borrowers default in waves • Dozens of sub-prime lenders file for bankruptcy • The substantial holdings of MBS world-wide tank and some of the biggest institutions gasp for air. • Fannie and Freddie seized by the federal government. THE PERFECT STORM
Bank Failures: 183 (2%) 12/07-2/10 (No deposits lost) • Unemployment Rate: 10.2% (10/09) • Economic Decline: -3.8% (2Q 2008-2Q 2009) • Biggest Drop in DJIA: -53.8% (10/9/07-3/9/09) • Change in Prices: +0.5% (12/07–3/09) • Emergency Spending Programs: 2.5% of GDP for two years • Increase in Money Supply by the Fed: 125% (9/08-12/09) THE GREAT RECESSION
6.7 million jobs lost between 1/08 and 1/10 • Capital investment levels lowest in 50 years • Domestic demand declines 11 consecutive quarters • Industrial production down world-wide: Japan 31%, Korea 26%, Russia 16%, Brazil 15%, Italy 14%, Germany 12% THE GREAT RECESSION
BAILOUT TRACKER Sources: Federal Reserve, Treasury, FDIC, CBO, White House (as of 11/16/2009)