Download
1 / 42
420 likes | 528 Vues
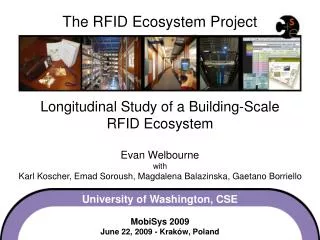
The RFID Ecosystem Project Longitudinal Study of a Building-Scale RFID Ecosystem. Evan Welbourne with Karl Koscher, Emad Soroush, Magdalena Balazinska, Gaetano Borriello University of Washington, CSE MobiSys 2009 June 22, 2009 - Kraków, Poland. Focus: Pervasive RFID Systems.

E N D
The RFID Ecosystem Project Longitudinal Study of a Building-ScaleRFID Ecosystem Evan WelbournewithKarl Koscher, Emad Soroush, Magdalena Balazinska, Gaetano Borriello University of Washington, CSEMobiSys 2009June 22, 2009 - Kraków, Poland
Focus: Pervasive RFID Systems http://rfid.cs.washington.edu/ • RFID tags on people and objects • Higher-level events are inferred RFID Trace: “Working in Office”
Focus: Pervasive RFID Systems http://rfid.cs.washington.edu/ • RFID tags on people and objects • Higher-level events are inferred • High-performance passive tags EPC Gen 2 tags • What does the data from a pervasive system look like? • How well do the tags perform? • Can performance be improved? • Will users adopt passive RFID tags? • Do users accept applications built on passive RFID? • Past studies are limited to lab-like settings… VS. Active Tags [ http://www.aeroscout.com] Track Hospital’s Equipment, Staff [ http://www.pcts.com] Detect CareMilestones Passive Tags • Battery-powered • $10 - $100 (US) • Reliable location stream • No batteries • < $1 (US) • Less reliable location [ http://www.pcts.com]
Longitudinal Study • 4-week study of a building-scale RFID deployment: • EPC Gen 2 RFID • 67 participants • 300+ tags • Location apps • Summary: • 1.5M tag reads • 38,000 antenna visits • 9 lost or broken tags • 9,000 application operations by participants • 0 reported privacy breaches
Outline • Deployment overview • Data rates and system loadWhat does the data from a pervasive system look like? • Tag PerformanceHow well do passive tags perform in practice? • Probabilistic InferenceCan performance be improved in software? • End-user tag managementWill users adopt passive tags? • ApplicationsDo users accept applications based on passive RFID?
Outline • Deployment overview • Data rates and system loadWhat does the data from a pervasive system look like? • Tag PerformanceHow well do passive tags perform in practice? • Probabilistic InferenceCan performance be improved in software? • End-user tag managementWill users adopt passive tags? • ApplicationsDo users accept applications based on passive RFID?
The RFID Ecosystem • CSE Building (8,000 m2) • 47 Readers, 160 Antennas • Installed in 3 configurations First Floor Entrance (not shown on map)
RFID Tags • Three tag designs • 324 tags on 19 types of objects: • Personal Badges • Bags • Clothing • Keys • Wallets, Purses • Books • Paper, binders • iPods, Laptops, Phones • Food / Water Containers • And more…
RFID Data Streams • Tag Read Events (TREs) and STAYs • TRE: (tag, antenna, time) • STAY: (tag, antenna, start time, stop time) • Example:
Outline • Deployment overview • Data rates and system loadWhat does the data from a pervasive system look like? • Tag PerformanceHow well do passive tags perform in practice? • Probabilistic InferenceCan performance be improved in software? • End-user tag managementWill users adopt passive tags? • ApplicationsDo users accept applications based on passive RFID?
Outline • Deployment overview • Data rates and system loadWhat does the data from a pervasive system look like? • Tag PerformanceHow well do passive tags perform in practice? • Probabilistic InferenceCan performance be improved in software? • End-user tag managementWill users adopt passive tags? • ApplicationsDo users accept applications based on passive RFID?
Data Rates and System Load Unlike supply chain RFID applications…Amount of data generated is very manageable Total raw data: 53 MB Compresses to: 1 MB Peak Rate: 8400 TRE / hour Scale to 1M tags: ~ 100 MB / day • Explanation: • Fewer tags than in the supply chain • No antennas inside offices • Many tagged objects never move • Supply chain numbers may not be compressed
Data Rates and System Load Like similar studies in wireless mobility…Load mirrors patterns of building occupancy US Veteran’s Holiday US Thanksgiving Holiday • “Hot spot” antennas: • Outside research lab • Outside student store Major Undergrad Project Due • Implications: • Makes sense to allocate more resources to hot spots • Predictable off-peak times for batch processing
Outline • Deployment overview • Data rates and system loadWhat does the data from a pervasive system look like? • Tag PerformanceHow well do passive tags perform in practice? • Probabilistic InferenceCan performance be improved in software? • End-user tag managementWill users adopt passive tags? • ApplicationsDo users accept applications based on passive RFID?
Outline • Deployment overview • Data rates and system loadWhat does the data from a pervasive system look like? • Tag PerformanceHow well do passive tags perform in practice? • Probabilistic InferenceCan performance be improved in software? • End-user tag managementWill users adopt passive tags? • ApplicationsDo users accept applications based on passive RFID?
Tag Performance 1358 web-surveys collected ground truth location data We compute Detection-Rate: Probability that a tag is detected by a nearby antenna
Tag Performance Compared to performance in controlled laboratory studies…Performance was significantly worse Key Factors: 1) Tag design 2) Object type 3) Mounting • Implications: • Must cope with high uncertainty in raw data • Performance engineering opportunities: Larger antennas work better ex: wallet, purse, keys More RF-absorbent Tags held tight against body High variance:Differences in tag mounting(Also slight differences in material composition) ex: bag, hat, helmet, jacket Less RF-absorbent Tags more separated from body • Best design • Better mounting • Redundancy* All lower than detection rate in lab studies Other factors: simultaneous mobile tags, RF interference,…
Outline • Deployment overview • Data rates and system loadWhat does the data from a pervasive system look like? • Tag PerformanceHow well do passive tags perform in practice? • Probabilistic InferenceCan performance be improved in software? • End-user tag managementWill users adopt passive tags? • ApplicationsDo users accept applications based on passive RFID?
Outline • Deployment overview • Data rates and system loadWhat does the data from a pervasive system look like? • Tag PerformanceHow well do passive tags perform in practice? • Probabilistic InferenceCan performance be improved in software? • End-user tag managementWill users adopt passive tags? • ApplicationsDo users accept applications based on passive RFID?
Probabilistic Inference To further improve performance on top of uncertain RFID data…Probabilities help, must be applied with care • Tackle inherent uncertainty of event detection as well • Approach: • Probabilistic model of location w/particle filter • Process with probabilistic event detection engine • Evaluation: “Entered-Room” using survey results • Despite high uncertainty: • 60% correct room, 80% correct vicinity • But doesn’t work when detection rate < 0.5 • Probabilistic data is computationally expensive ? ? ? ?
Outline • Deployment overview • Data rates and system loadWhat does the data from a pervasive system look like? • Tag PerformanceHow well do passive tags perform in practice? • Probabilistic InferenceCan performance be improved in software? • End-user tag managementWill users adopt passive tags? • ApplicationsDo users accept applications based on passive RFID?
Outline • Deployment overview • Data rates and system loadWhat does the data from a pervasive system look like? • Tag PerformanceHow well do passive tags perform in practice? • Probabilistic InferenceCan performance be improved in software? • End-user tag managementWill users adopt passive tags? • ApplicationsDo users accept applications based on passive RFID?
End-User Tag Management To encourage optimal tag performance…Tag use must be supported and incentivized • Participants mounted & managed their own tags • Only basic guidelines and reminders for 3 weeks • Experts remounted poorly performing tags in week 4 • Exit survey for 67 participants also showed: • 41 often forgot to carry tags • 8 found tags socially awkward to carry/wear • 19 said tags were inconvenient or uncomfortable • 9 tags reported lost or broken
Outline • Deployment overview • Data rates and system loadWhat does the data from a pervasive system look like? • Tag PerformanceHow well do passive tags perform in practice? • Probabilistic InferenceCan performance be improved in software? • End-user tag managementWill users adopt passive tags? • ApplicationsDo users accept applications based on passive RFID?
Outline • Deployment overview • Data rates and system loadWhat does the data from a pervasive system look like? • Tag PerformanceHow well do passive tags perform in practice? • Probabilistic InferenceCan performance be improved in software? • End-user tag managementWill users adopt passive tags? • ApplicationsDo users accept applications based on passive RFID?
Applications • Standard location-aware applications • Built using Cascadia system (MobiSys 2008) • Event detection over deterministic raw data
Applications – Privacy Contrary to expectation… Very few participants concerned w/personal privacy • Tool for deleting data was used “only as a test” • Relatively few operations to manage privacy • Many said: “Not concerned about tracking in CSE” “More concerned about employer or gov’t” • Only 7 participants removed tags for privacy reasons • 12 reported behavior change (e.g., arriving earlier) • 0 reported privacy breaches • [See IEEE Pervasive 07, Internet Computing 09 for more on privacy]
Applications - Adoption Applications were “novel, fun, useful” depending on… Ease of use, participating friends, tag performance • Exit-survey for 67 participants showed: • Most found apps novel, fun; 15 found them truly useful • Barriers: log-in (18), lack of friends (15), poor tags (5) • Requested features: • Push-based interfaces (Desktop Feed gadget) • More complex events, historical data (“Digital Diary”) • Future Work: • Push information to users rather than pull • Support more complex events, historical queries
Summary • Through longitudinal study in a pervasive deployment: • Data rates and system load are quite manageable • Tag performance worse than in lab but there’s hope • Probabilistic inference helps but must be applied w/care • End-users need substantial support in mounting tags, applications are a good incentive • Users accept applications (when they work), but more sophisticated functionality is desired • Conclusion: • Pervasive computing with passive RFID is feasiblebut extensive optimizations are required
Thank you! • See our website for more information: • http://rfid.cs.washington.edu/ • http://rfid.cs.washington.edu/publications.html
Backup Slides Backup Slides…
EPC Gen 2 RFID Equipment • 3 types of tags: • Lab benchmarks showing read-rate: FleXwing Excalibur PVC Card
Recruiting Participants • Email sent to Faculty, Staff, grads, undergrads • $30 for participation • + $10 for completing >= 25% of surveys • + $20 for completing >= 50% of surveys
Hourly Data Rates • Total: • 1.5M TREs • 38K STAYs • Max Rate: • 8408 TRE/hr • 601 STAY/hr • Min Rate: • 0 TRE/hr • 0 STAY/hr
People and Objects • Participants: Almost no data or a lot of data • Some forgot tags often; Some not in bldg • Objects: Same trend • Mobility of object; Material of object
Load Distribution • Some antennas are “hot spots” • Similar to wifi mobility studies
Survey Responses • 2226 Surveys Sent, 1358 Received • 18 seconds to complete (avg)
Application Usage • Usage varies by participant • 0.37 correlation: data generated and app usage
More Recent Applications • Use Historical Data • View Trends
Ambient Awareness Friend and Object Finders Time Use Analysis Tools RFID-based Reminders Context-Aware Social Networking Supported by Cascadia System • Welbourne, E. et al., MobiSys 2008
Privacy Tools • Privacy Tools: • Data review tool • Access control tool
Issue: Basic Insecurity of RFID • Case Study: WA State Enhanced Driver’s License • DHS claims RFID “removes risk of cloning” • Can be cloned easily in less than a second w/cheap device • Can be read more than 75 ft away • Sleeve doesn’t always work, worse when crumpled # EDL Reads, Week of Apr 27th Case study credit: Karl Koscher, Ari Juels, Tadayoshi Kohno, Vjekoslav Brajkovic