Download
1 / 64
640 likes | 660 Vues
Explore the presence and properties of dark halos in galaxies through observations and simulations, and understand their impact on the rotation curves. Investigate the maximum disk interpretation and its implications for the density and size of dark halos.

E N D
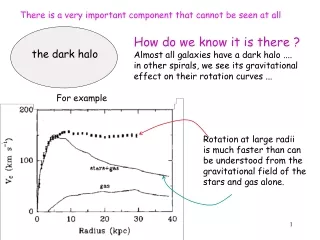
There is a very important component that cannot be seen at all How do we know it is there ? Almost all galaxies have a dark halo .... in other spirals, we see its gravitational effect on their rotation curves ... the dark halo For example Rotation at large radii is much faster than can be understood from the gravitational field of the stars and gas alone.
Dark Matter in Galaxies We believe that galaxies formed through a hierarchy of merging. The merging elements were a mixture of baryonic and dark matter. The dark matter settled into a partially virialized spheroidal halo while the baryons (in disk galaxies) settled into a rotating disk and bulge What can we learn about the properties of dark halos ? Do the properties of dark halos predicted by simulations correspond to what is inferred from observational studies ?
V(R) flat the enclosed mass M(R) R M(R) R is not what we would expect for a gravitating system of stars : we would expect the Keplerian M(R) R 1/2 Is this evidence for a dark halo ?Not necessarily : it depends on how far the rotation curve extends. Most spirals have a light distribution that is roughly exponential: I(R) = Io exp (- R / h) (for a large galaxy like the Milky Way, the scale length h ≈ 3-4 kpc)
Optical rotation curves, measured from the spectra of ionized gas, typically extend to R ≈ 3 h Now assume that the surface density distribution of stars in our disk galaxy follows the optical surface brightnessdistribution. Can this surface density distribution, with its gravitational potential (R) explain the observed rotation curve V(R) ? The answer to this question is yes and no
Yes, for optical rotation curves extending out to about 3 disk scale lengths: In the next slide, the points are the observations and the curve is the expected rotation curve Despite the very different shapes of the two rotation curves, the light distribution can explain the observed optical rotation curves out to about 3 scale lengths Optical rotation curves out to ~ 3 scale lengths do not tell us very much about dark matter in spirals
Two very different rotation curves. The points are the rotation data and the curves are as expected if mass follows light. The only scaling is through the adopted M/L ratio
No for galaxies with 21 cm HI rotation curves that extend far out, to R >> 3 h. eg maximum disk decomposition for NGC 3198: M/LB = 3.8 for disk observed Begeman 1987
For NGC 3198 the HI rotation curve extends out to 11 h. (for some galaxies the rotation data go to more than 20 h) The expected V(R) from stars and gas falls well below the observed rotation curve in the outer region of the galaxy. This is seen for almost all spirals with rotation curves that extend out to many scale lengths. We conclude that the luminous matter dominates the radial protential gradient ∂∂R forR < 3hbut beyond this radius the dark halo becomes progressively more important.
Typically, out to the radius where the HI data ends, the ratio of dark to luminous mass is 3 to 5: values up to about 10 are found in a few examples. This is a lower limit on the ratio of (total dark mass) to luminous mass
For the decomposition of NGC 3198, the stellar M/L ratio was taken to be as large as possible without leading to a hollow dark halo - this is a maximum disk (minimum halo) decomposition. Many galaxies have been analysed in this way - the decomposition often works out as for NGC 3198, with comparable peak circular velocity contributions from disk and dark halo Some people believe that maximum disk decompositions are not correct
The maximum disk question is important for us here, because inferences about the properties of dark halos from rotation curves depend so much on the correctness of the maximum disk interpretation. eg if the maximum disk decompositions are correct, then the dark halos have approximately uniform density cores which are much larger than the scale length of the disk
In contrast, the halos that form in cosmological simulations have steeply cusped inner halos with r -1 or even steeper near the center
Optical rotation curves favor the maximum disk interpretation. In the inner regions of the disks of larger spirals, the rotation curves are well fit by assuming that mass follows light. eg Buchhorn (1991) analysed 552 galaxies with optical V(R) and I-band surface photometry, and a wide range of rotation curve morphology. He was able to match the rotation curves well for 97% of his sample, with realistic M/L ratios (including the kinks and bumps as in the right panel)
The implication is that either the stellar disk dominates the gravitational field in the inner parts of the disk (R < 3h) or the potential gradient of the halo faithfully mimics the potential gradient of the disk in almost every spiral, which seems very unlikely stop
How to model the dark halo The goal is to estimate typical parameters for dark halos (density, scale length, velocity dispersion, shape) to compare with halo properties from simulations Since about 1985, observers have used model dark halos with constant density cores to interpret rotation curves Carignan & Freeman (1985) made the first rotation curve decomposition into contributions from the stellar disk, gas and dark halo. We used the realnon-singular isothermal sphere (computed from Poisson's equation) to model the dark halo. It has a flat core, a well defined core radius and central density, and has r -2 at large radius, so V(r) ~ constant, as is usually observed.
A simple analytic form is the pseudo-isothermal sphere o {1 + (r / rc ) 2 } -1 which again has a flat core, a well defined core radius and central density, and has ~ r - 2 at large radius. Although they have similar asymptotic behaviour, the rotation curves of the real and pseudo isothermal models are different and will give different halo parameters when used inrotation curve decompositions real V(R) pseudo R
Using the pseudo isothermal model for the dark halo of large galaxies like the Milky Way, we find that o ~ 0.01 M pc -3 and rc ~ 10 kpc (for comparison, the stellar density of ourGalaxy near the sun is about 0. 1 M pc -3 ) We will see later that the values of o and rc depend strongly on the luminosity of the galaxy.
Another model with a flat core that is sometimes used in rotation curve decompositions is Burkert's (1995) model (r) =B (1 + r/rB) -1{1 + (r/rB)2} -1 Its (r) ~ r -3 at large r, like the NFW model (later)
NGC 6822 V These models have flat central cores : why were they used ? I think it was because • rotation curves of spirals do appear to have an inner solid-body component which indicates a core of roughly constant density • hot stellar systems like globular clusters were successfully modelled by King models, which are modified isothermal spheres with flat central cores R
On the other hand .... CDM simulations consistently produce halos that are cusped at the center. This has been known since the 1980’s, and has been popularized by Navarro et al 1996 with the NFW density distribution which parameterizes the CDM halos (r / rs ) - 1 {1 + (r/rs)} - 2 These are cusped at the center, with r - 1
We have suffered a long controversy over the last decade about whether the rotation curves imply cusped or cored dark halos. This continues to be very illuminating Galaxies of low surface brightness are important in this debate. The normal or high surface brightness spirals have a fairly well defined characteristic surface brightness scale (central surface brightness around 21.5 B mag arcsec -2) In the LSB galaxies the disk density can be more than 10 x lower than in the normal spirals. These LSB disks are fairly clearly sub-maximal and the rotation curve is dominated everywhere by the dark halo.
The observational problem is to determine the shape of the rotation curve near the center of the galaxies - a cored halo gives a solid body rotation curve near the center, while a cusped halo has a steep slope at small r Observationally it is not easy to tell. HI rotation curves have limited spatial resolution so the beam smearing can mask the effects of a possible cusp. 2D optical rotation data (Fabry-Perot) have much better resolution - current data favor a cored halo. . Example of NGC 6822, a Local Group LSB galaxy
NGC 6822 Local Group LSB galaxy in near-IR. HI map has 20 pc resolution
High spatial resolution HI observations of Local Group LSB galaxy NGC 6822 min disk min disk + gas pseudo isothermal halo a real isothermal would be better SPS M/L max disk Weldrake et al 2002
High spatial resolution HI observations of Local Group LSB galaxy NGC 6822 NFW halo Not as good as the isothermal Weldrake et al 2002
Sample of about 60 LSB galaxies NFW optical rotation curves give inner slope of density distribution NFW halos have = -1 Flat cores have = 0 Distribution of inner slope of density ~ r de Blok et al 2002
How large and massive are the dark halos of large spirals like the Milky Way ? Flat rotation curves => M(r) ~ r, like the isothermal sphere : ~ r-2 This cannot go on for ever - the halo mass would be infinite. Halos must have a finite extent and mass, and their density distribution must truncate or be steeper than ~ r-3 at very large r. eg NFW with (r / rs ) - 1 {1 + (r/rs)} - 2 has ~ r-3 at large r.
Tracers of dark matter in the Galaxy (rotation curve to ~ 20 kpc, kinematics of metal poor stars, globular clusters and satellites out to ~ 50 kpc) indicate that the halo mass M(r) = r(kpc) x 1010 solar masses. Again, this is what we expect if ~ r-2 ie the rotation curve stays approximately flat at 220 km/s out to 50 kpc. How large are dark halos - how far in radius do they extend ?
Timing argument M31 (Andromeda) is now approaching the Galaxy at 118 km s-1. Its distance is about 750 kpc. Assuming their initial separation was small and the age of the universe is say 18 Gyr, we can estimate a lower limit on the total mass of the Andromeda + Galaxy system. The Galaxy’s share of this mass is (13 2) x 1011 solar masses. A similar argument using the Leo I dwarf at a distance of about 230 kpc gives (12 2) x 1011 solar masses.
The relation for the mass of the galactic halo M(r) = r (kpc) x 1010 solar masses out to r ~ 50 kpc then indicates that the dark halo extends out beyondr = 120 kpc if the rotation curve remains flat ie if (r) ~ r -2 and possibly much further than 120 kpc if the density distribution declines more rapidly at large radius
This radius is much larger than the extent of any directly measured rotation curves, so this “timing argument” gives a realistic lower limit on the total mass of the dark halo. For our Galaxy, the luminous mass (disk + bulge) is about 6 x 10¹⁰ solar masses The luminosity is about 2 x 10¹⁰ solar luminosities The ratio of total dark mass to stellar mass is then at least 120/6 = 20 and the total M/L ratio is at least 60
Satellites of disk galaxies can also be used to estimate the total mass and extent of the dark halos of other bright spirals Individual galaxies have only a few observable satellites each, but we can make a super-system by combining observations of many satellite systems and so get a measure of the mass of a typical dark halo. eg Prada et al (2003) looked at the kinematics of about 3000 satellites around about 1000 galaxies
With a careful treatment of interlopers, they find that the velocity dispersion of the super-satellite-system decreases slowly with radius The halos typically extend out to about 300 kpc but the density distribution at large radius is steeper than the isothermal: (r) ~ r -3, like most cosmological models including NFW The total M/L ratios are typically 100-150, compared with the lower limit from the timing argument of 60 for our Galaxy. (The Prada galaxies are bright systems, comparable to the Galaxy)
Prada et al 2003 Velocities |V| of 3000 satellites relative to their parent galaxy error bars show the velocity dispersion decreasing with radius out to ~ 300 kpc !
Back to the mass of the Galaxy .... Wilkinson & Evans (1999) used motions of 27 globular clusters and satellites : made a dynamical model of the halo and estimated the total mass to be Mtotal = 1.9 +3.6 - 1.7 x 10¹² Mor M(50) = 5.4 +0.2- 3.6x 10¹¹ M outto 50 kpc consistent again with M(r) = r (kpc) x 1010 M
M31 has a similar rotation amplitude so its total mass may be similar to the total mass of the Galaxy. Evans & Wilkinson (2000) used satellites and GCs in M31 to derive a lower mass of 1.2+3.6 -1.7x 10¹² M for M31 - similar to the Galaxy, within the uncertainties So the total mass of MW + M31 ~ 3 x 10¹² M For comparison, from least action arguments, the likely mass of the local group is 4-8 x 10¹² M ( Peebles 1996, Schmoldt & Saha 1998) Within the uncertainties, most of the mass in the Local Group could be in the two large spirals
Timing M31-MW (eg Zaritsky 1999 ) gives 3-4 x 10¹² M for MW and M31 together, ignoring tranverse motions and growth of halo with time and overlap of halos at early times (all of these would increase the mass) Least action arguments like Schmoldt & Saha use more galaxies and give similar result Kochanek (1996) put together timing, velocity dispersion and escape velocity arguments and derived M(200kpc) = 0.5-2 x 10¹² M Zaritsky concludes that the data are consistent with an isothermal halo with Vc ~ 180-220 km/s, extending out to about 200 kpc, with M > 1012 M - see fig on next slide
all more or less consistent with M(r) = r (kpc) x 1010 M out to about 200 kpc Zaritsky 1999
More recent estimates give similar MW halo properties Sakamoto et al 2003: 11 satellites, 137 GCs and 413 HB stars out to 10 kpc from the sun. To keep these objects bound in a flat rotation curve potential, the mass is about (2 +0.5-1.0) x 1012 M. Out to 50 kpc, M = 5.5 x 10¹¹ M (This is a widely agreed number) Battaglia et al 2005: 240 halo objects with distances and radial velocities: satellites, GCs, HB stars, halo giants (spaghetti) to derive the (r) relation. The (r) is constant at 120 km/s out to 30 kpc, then drops to 50 km/s at 120 kpc. Adopting the tracer density distribution (r) ~ r -3.5, the halo mass is (1.2 +1.8-0.5) x 1012 M on a scale of ~ 120 kpc
Halo tracers (r) (r) Battaglia et al 2005
Best fit: truncated flat rotation curve halo M ~ 1.2 x 10¹² M : constant anisotropy, scale ~ 120 kpc Battaglia et al 2005
Dehnen (2006) argued that the Battaglia tracers are consistent with a non-truncated isothermal halo if the tracer population truncates at r ~ 160 kpc, again assuming constant anisotropy. Finds a similar mass to Battaglia's. A non-kinematical estimate: Bellazini (2004) used tidal radii of outer GC in the Galaxy to derive the total mass: finds (1.3 +2.9-1.0) x 1012 M out to 90 kpc Agrees well with kinematical estimates
Conclusion The total mass of the Milky Way is ~ 1.5 x 10¹² M The MW is one of the few galaxies for which we have an estimate of the total mass, rather than just the mass out to the end of a rotation curve. The stellar mass is about 6 x 10¹⁰ M So the stellar baryons are only about 4% of the total mass Compare this with the universal baryon / matter = 15%
Dark halo of M31 Large spiral with prominent bulge. Little recent work on rotation curves of M31 and M33
Out to 35 kpc, M* = 2.3 x 10¹¹ M, Mhalo = 1.1 x 10¹¹ M, so stellar mass dominates. M(35 kpc) = 3.4 x 10¹¹ M: compare with Milky Way M(50 kpc) = 5 x 10¹¹ M (HI : GBT & Effelsberg) Carignan et al 2006
Evans & Wilkinson (2000) used satellites and GCs in M31 to derive a lower limit on the mass of 1.2+3.6 -1.7x 10¹² M for M31 - similar to the Galaxy, within the uncertainties
Dark halo of M33 Almost pure disk galaxy, normal surface brightness
V(R) to 13 scale lengths halo Halo dominates for R > 3 kpc ≈ 3 scale lengths disk gas Mhalo > 5 x 10 10 M, Mhalo / Mbar = 5 out to R = 15 kpc Corbelli & Salucci 2000