Download
1 / 42
420 likes | 529 Vues
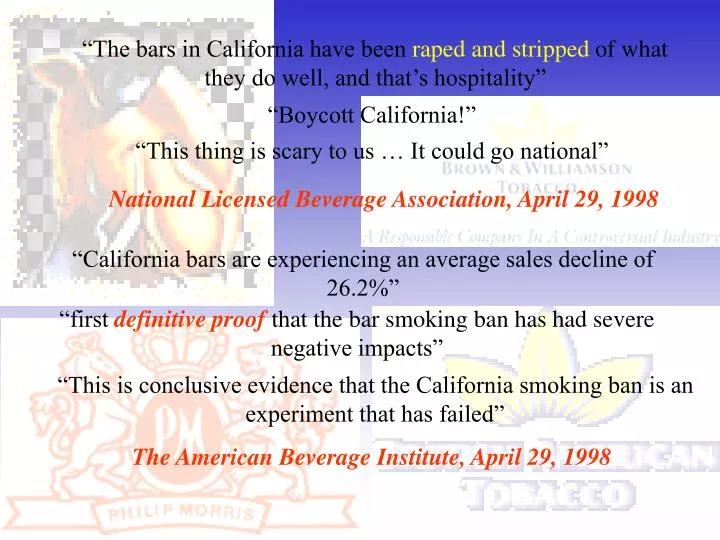
“The bars in California have been raped and stripped of what they do well, and that’s hospitality”. “Boycott California!”. “This thing is scary to us … It could go national”. National Licensed Beverage Association, April 29, 1998.

E N D
“The bars in California have been raped and stripped of what they do well, and that’s hospitality” “Boycott California!” “This thing is scary to us … It could go national” National Licensed Beverage Association, April 29, 1998 “California bars are experiencing an average sales decline of 26.2%” “first definitive proof that the bar smoking ban has had severe negative impacts” “This is conclusive evidence that the California smoking ban is an experiment that has failed” The American Beverage Institute, April 29, 1998
Countering Industry-Initiated Economic Arguments • History of Tobacco Control in California • The Wheels Are Turning 1985 -1994 • Labor Code Implementation • Fiscal Impact (The Science) • What “The Science” Means • Tourism • Businesses • Employment • The Future
Effects Causally Associated with ETS Exposure • Low Birth Weight • SIDS • Respiratory Infections in Children • Asthma: Induction and Exacerbation • Eye and Nasal Irritation • Ear Infections in Children • Cancer: Lung and Nasal Sinus • Heart Disease Morbidity & Mortality Source: Health Effects of Exposure to ETS, California EPA, September 1997
Estimated Annual Morbidity & Mortality in Non-Smokers from ETS Exposure in California • 147,660 - 351,820 Illnesses & Hospitalizations • 4,696 - 7,945 Deaths Source: Health Effects of Exposure to ETS, California EPA, September 1997
The Law • Regulates smoking by employees and patrons in most “enclosed” workplaces in California. • Adopted as part of the Labor Code to protect workers from involuntary exposure to ETS. • Both business owners and patrons may be issued a citation. • Is enforced at the lowest jurisdictional level. • Does not apply to owner operated establishments or Native American (sovereign) lands among other exemptions.
Primary “On-Sale” Alcohol License Types • Type 40: On-Sale Beer (Beer Bar) - 1,510 • Type 41: On-Sale Beer and Wine Eating Place (Pizza Place) - 20,113 • Type 42: On-Sale Beer and Wine Public Premises (Beer and Wine Bar) - 1,202 • Type 47: On-Sale General Eating Place (Full-Service Restaurant) - 10,966 • Type 48: On-Sale General Public Premises (Stand-Alone Bar) - 3,261 These numbers are from June 30, 2000 and these five types constitute 94-96% of all On-Sale licenses in California annually
Smoke-free Workplace TimelineHighlights • June, 1994: Assembly Bill 13 Signed by Governor and becomes Labor Code Section 6404.5; • November 1994: Proposition 188 (Philip Morris Initiative) defeated (71% to 29%) guaranteeing LC 6404.5 stays in place; • January 1, 1995: Nearly all enclosed workplaces go smoke-free; • 1996: AB 3037 passes postponing Bar/Gaming Club implementation by one year; • January 1, 1998: All bars, gaming clubs and bingo halls go smoke-free: #1 Media Story in the Country!
Smoking in Bars & Compliance • 75%of California Bar PatronsDON’T SMOKE IN BARS (1997) • 86% of Bar Patrons REPORT COMPLIANCE WITH THE LAW (2000) July 1997 and October 2000 studies conducted by the Field Poll Corporation for the California Department of Health Services, Tobacco Control Section.
Study Populations • July 1997 Field Poll • Total Respondents: 1,023 • Bar Patrons in the Last Twelve Months: 686 (67%) • Smokers: 215(21%) • Non Smokers: 808 (79%) • March 1998 Field Poll • Total Respondents 1,001 • 100% Patronized Bars in the Last Twelve Months • Smokers: 255 (25%) • Non Smokers: 745 (75%) • August 1998 Field Poll • Total Respondents 1,020 • 100% Patronized Bars in the Last Twelve Months • Smokers: 255 (25%) • Non Smokers: 765 (75%) • October 2000 Field Poll • Total Respondents 1,020 • 100% Patronized Bars in the Last Twelve Months • Smokers: 255 (25%) • Non Smokers: 765 (75%)
USA SNAPSHOTS® A look at statistics that shape the nation Smoke gets in their hair More than half of Americans say they regularly avoid places to keep from smelling of cigarette smoke afterward. Places they avoid: Bars/lounges Nightclubs Homes of smokers Restaurants Private parties 70% 59% 59% 48% 33% Source: NFO Research for Banish By Anne R. Carey and Suzy Parker, USA TODAY
Bar Patrons Support Smoke-Free Bars A Survey of California Bar Patrons: July 97, August 98 & October 2000 July 1997, August 1998 & October 2000 studies conducted by the Field Poll Corporation for the California Department of Health Services, Tobacco Control Section.
Bar Patrons More Likely to Visit Smoke-Free Bars Now that smoking is prohibited in bars, are you more likely, …, to visit them? 10.6% “less likely” to visit bars 56.4% “more likely” to visit bars 31.4% “no difference” on visits to bars 1.6%No opinion October 2000 study conducted by the Field Poll Corporation for the California Department of Health Services, Tobacco Control Section.
Bar Patrons More Likely to Visit Smoke-Free Bars Now that smoking is prohibited in bars, are you more likely, …, to visit them? Percent August 98 & October 2000 studies conducted by the Field Poll Corporation for the California Department of Health Services, Tobacco Control Section.
Patron Approval for Smoke-free Bars FIELD POLL February 1998, August 1998 & October 2000. Approval for Smoke-free Bars Increases March 1998, August 1998 & October 2000 studies conducted by the Field Poll Corporation for the California Department of Health Services, Tobacco Control Section
Quality Literature on Smoke-Free Bars and Restaurants • Data for towns with smoke-free restaurant laws • Massachusetts (Bartosch and Pope, 1999) • New York City (Hyland et al., 1999) • Data for towns with smoke-free restaurant and bar laws • California and Colorado (Glantz and Smith, 1994, 1997)
Quality Literature on Smoke-Free Bars and Restaurants • Aggregate sales data for state restaurant and bar laws • California (Glantz, 2000) • Taxable sales and tourism • 3 States and 6 cities (Glantz and Charlesworth, 1999)
Poor Quality Literature on Smoke-Free Bars and Restaurants • Supported by Tobacco Industry • Survey of bar owners on predicted impacts or anecdotal information • Bizarre time periods or inappropriate control groups for comparison • Non-peer reviewed
Data • From California Board of Equalization (BOE) from Q1 of 1990 to Q4 of 2000 • Categorized as follows: • Eating and drinking establishments that serve all types of liquor (about 25% stand-alone bars) • Eating and drinking establishments that serve beer and wine • Eating and drinking establishments that serve no alcoholic beverages
Eating establishment’s taxable annual sales in California by liquor license type, 1992-1999 Billion Dollars Smoke-free Restaurants Smoke-free Bars Source: California State Board of Equalization. Prepared by: California Department of Health Services, Tobacco Control Section, November 2001.
Methodology • Examine bar sales divided by all retail sales • Tries to account for underlying economic trends and inflation • Examine bar sales divided by all eating and drinking sales • Change in proportion
Methodology • Variables considered for modeling • Quarter, Time • Change in intercept and slope for smoke-free restaurants • Change in intercept and slope for smoke-free bar law • Autoregressive error terms • “Proc Autoreg” in SAS V8
Percentage of quarterly bar revenues as a total of all retail revenues, 1990-2000 Smoke-free restaurant law Smoke-free bar law Percentage Source: California State Board of Equalization. Prepared by: California Department of Health Services, Tobacco Control Section, November 2001
Bar/Retail Results • No change in intercept and slope after implementation of smoke-free bar law • Change in intercept and slope after implementation of smoke-free restaurant law
Percentage of quarterly bar revenues as a total of all eating and drinking revenues, 1990-2000 Smoke-free restaurant law Smoke-free bar law Percentage Source: California State Board of Equalization. Prepared by: California Department of Health Services, Tobacco Control Section, November 2001.
Percentage of quarterly bar revenues as a total of all eating and drinking revenues, 1990-2000 Smoke-free restaurant law Smoke-free bar law Percentage Source: California State Board of Equalization. Prepared by: California Department of Health Services, Tobacco Control Section, November 2001.
Bar/All E&D Results • Change in intercept and slope after implementation of smoke-free bar law • Change in intercept and slope after implementation of smoke-free restaurant law
Conclusions • Slowing in decrease of bar/retail sales associated with the smoke-free restaurant law • Due to only 25% of “bars” being stand alone bars, the law could have increased sales at the 75% bar/restaurant combinations • No negative change in “bar” sales for either smoke-free law
Conclusions • The decrease in bar/all E&D sales has reversed and is now increasing • A portion of it can be explained by the smoke-free restaurant and the smoke-free bar law • Limitations • Retail sales are changing at a rate different than bar sales possible change in consumption change in demographics • 25% of “bars” are stand alone bars
Conclusions • Bar patrons - spending more time in bars • Smokers prefer smoke-free bars and restaurants • Because of large scale of data, length of time and sound methodology, use to contradict anecdotal data from TI and front groups
Tourism in CaliforniaCalifornia Travel Spending and Related Impacts: 1995-2000 Billions of Dollars Source: California Trade and Commerce Agency, Division of Tourism, October, 2001 “Total Payroll” definition changed in 1999 to include sole proprietors such as owners of Bed & Breakfasts and their family members instead of just the hired staff of such establishments. Destination Spending includes spending on accommodations, eating and drinking, groceries, ground transportation, recreation and retail sales. Total spending also includes air transportation and travel arrangement services.
Tourism and EmploymentCalifornia Travel Spending and Related Impacts: 1995-2000 Source: California Trade and Commerce Agency, Division of Tourism, October, 2001
Number of Eating and Drinking Establishments in California by Major License Type:1991-2000* Smoke-free Restaurants Smoke-free Bars Establishments Year Data reflects mid-year count of establishments. * Data missing for 1995 due to computer failure and loss of data. Source: State of California, Alcohol Beverage Control (5/00)
Number of Individuals Employed in Eating and Drinking Places in California: 1992-2000Annual Average Labor Force Smoke-free Restaurants Smoke-free Bars Number of Employees Increase of 19.5% in 9 years as compared to a 13.5% increase for all employment statewide over the same period. Year Source: State of California, Employment Development Department, Labor Force Statistics (4/01)
Taxable Sales per Eating and Drinking Establishment Serving All Alcohol in California:1993-1999 for Second Quarter Only* Smoke-free Restaurants Smoke-free Bars Dollars Increase of 30% in 7 years! Year Data reflects mid-year count of establishments (end of the second quarter). * Data missing for 1995 due to computer failure and loss of data at Alcohol Beverage Control. Source: State of California, Alcohol Beverage Control & Board of Equalization (5/00)
Taxable Sales per Eating and Drinking Establishment Serving Beer &/or Wine Only in California:1993-1999 for Second Quarter Only* Smoke-free Restaurants Smoke-free Bars Dollars Increase of 38.3% in 7 years! Year Data reflects mid-year count of establishments (end of the second quarter. * Data missing for 1995 due to computer failure and loss of data at Alcohol Beverage Control. Source: State of California, Alcohol Beverage Control & Board of Equalization (5/00)
Avg. Per-Capita Taxable Sales per Eating and Drinking Establishment Serving Alcohol vs. Eating and Drinking Group as a Whole in California:1993-2000 for Second Quarter Only* Smoke-free Restaurants Smoke-free Bars Since 1995, per-capita sales for all eating and drinking increased by 27% and establishments serving both food and alcohol increased by 25%. Dollars Year Source: State of California, Board of Equalization (12/01)
Keys to Success • Collaborate: You CAN’T do it alone. • Prepare and Educate: This won’t happen overnight. • Develop and Maintain a Solid Support Base: You can match their numbers, but this will be a time-intensive task. • Advertise: Make your issue known. Do it early and often.
Keys to Success • Educate Opinion Leaders: Educate key officials to become your advocates. • Gather Your Facts: Who will be impacted and how and why is this important to your target population. • Involve the Target: Survey the target audience to find out what they need and what will be most effective in reaching them - Give them what they need!. • Understand Diversity: Prepare culturally appropriate messages and delivery avenues.
Keys to Success • Uniformity in Implementation:Investigate or design, promote and implement a modifiable, but uniform implementation plan. • Consistency in Enforcement:Know who is enforcing the law and what message will promote “buy-in.” If any law is not enforced, it will not be respected.
Keys to Success • Never Forget the Past: Learn form your mistakes • Keep Your Eye on the Next Step: Where will your current strategy take you next?
Next Steps • Smoke-free Nursing Homes: 88.7% Support • Smoke-free Playgrounds: 88.1% Support • Smoke-free Hospital Grounds: 86.5% Support • Smoke-free Hotel Lobbies: 85.6% Support • Smoke-free Apartment Common Areas: 82.5% Support • Smoke-free Outdoor Entertainment Venues: 82.5% Support Field Research Corp - January 2001 - Survey of 1812 California Adults
For more information... David Cowling, Ph.D. California Department of Health Services Tobacco Control Section P.O. Box 942732, MS 555 Sacramento, CA 94234-7320 (916) 327-4446 dcowling@dhs.ca.gov Paul Hunting, MPH California Department of Health Services Tobacco Control Section P.O. Box 942732, MS 555 Sacramento, CA 94234-7320 (916) 322-6262 phunting@dhs.ca.gov Tim Filler Americans’ for Non-Smoker Rights 2530 San Pablo Avenue Suite J Berkeley, CA 94702 (510) 841-3032 tf@no-smoke.org